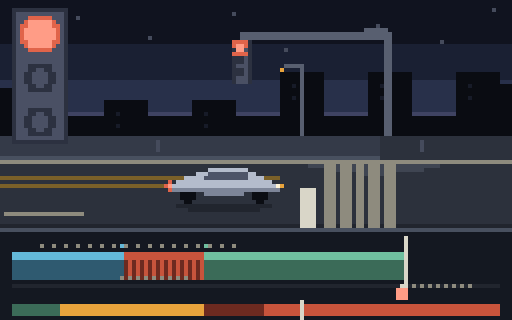



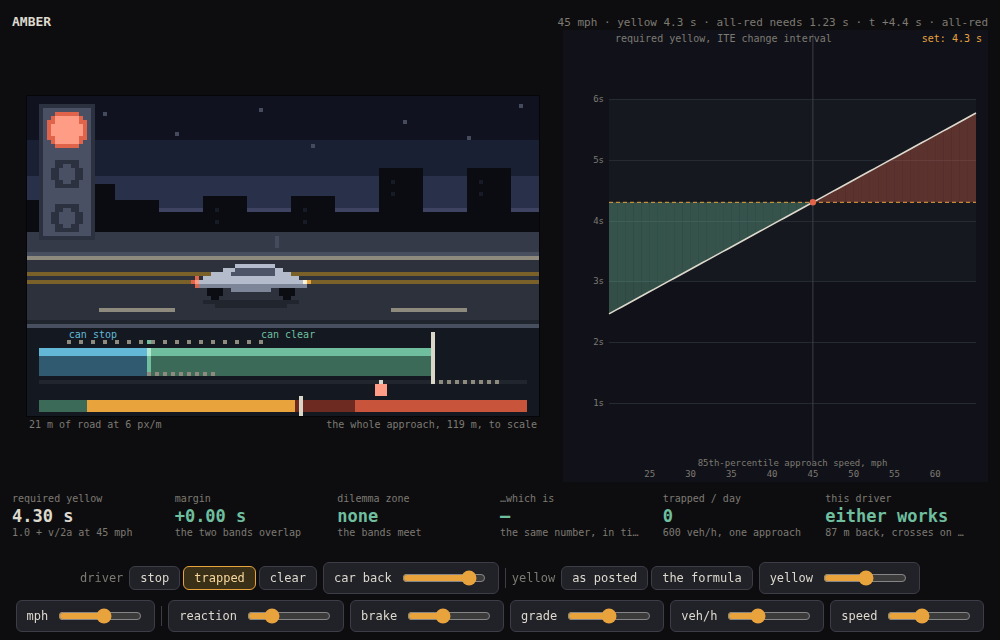
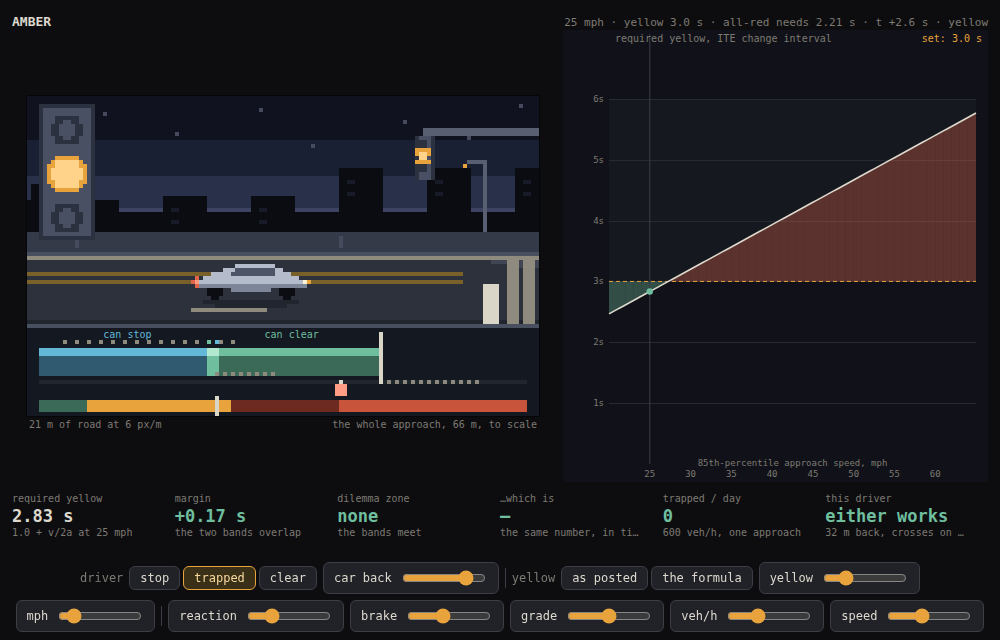
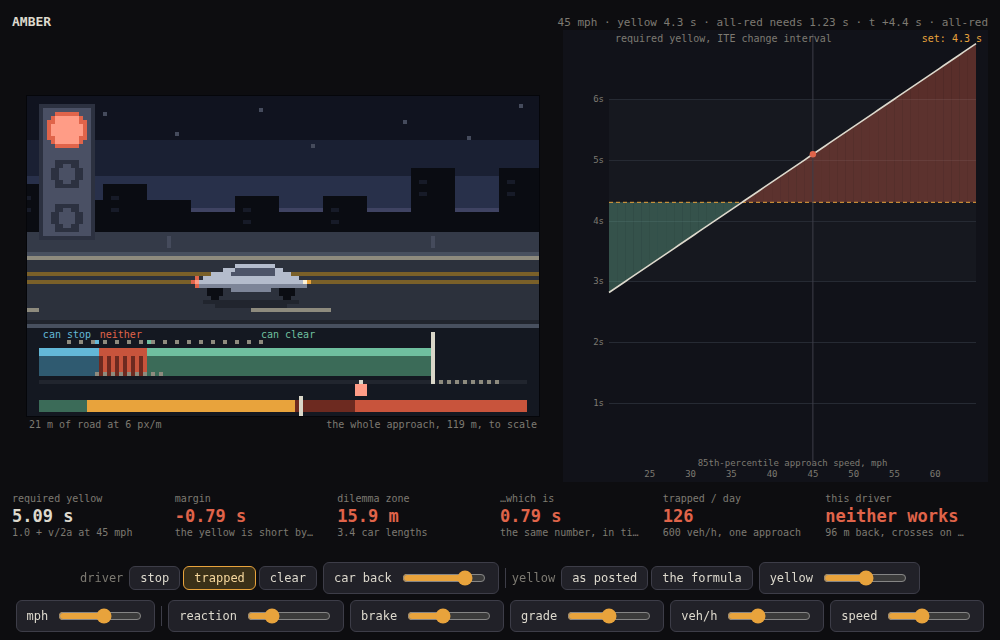
Yellow comes on. You are somewhere on the approach, doing whatever you were doing, and you now have exactly two lawful options. Each one is a distance.
To stop, you need to notice, decide, move your foot, and then brake — so
you need v·t + v²/2a of road, where t is perception-reaction time and a
is a deceleration you would actually choose. Call it Xs.
To go, you need to reach the stop bar before the light goes red, so you
need to be no further back than v·y.
Nothing requires those two to meet.
The band between them
If v·y < Xs there is a stretch of road between the furthest point you can
clear from and the nearest point you can stop from, and a driver who happens to
be standing on it when the yellow comes on has no lawful action at all.
That is the Type I dilemma zone. It is not a driver problem, or an attention
problem, or a problem that a sign fixes. It is a length of road that the
signal’s timing brought into existence.
Its length comes straight out of the two distances:
zone = Xs − v·y = v·(t + v/2a − y)and the bracket is the ITE change-interval formula — t + v/2a, the yellow
this approach needs — minus the yellow somebody actually set. Which means the
time a car spends crossing the band is
zone / v = (t + v/2a) − y = required yellow − set yellowand the speed cancels. The dilemma zone is the missing seconds of yellow, printed onto the asphalt. Half a second short is half a second of trapped driving on a 25 mph residential street and on a 60 mph arterial alike; the band stretches with speed, but exactly as fast as the car crossing it speeds up.
What the yellow has to be
Every number below is t + v/2a at the ITE values: a 1.0 s perception-reaction
time and 3.05 m/s² — ten feet per second squared, which is a third of what a
dry tyre will give you. That is deliberate. The formula asks what a driver will
comfortably do, not what the car can survive.
| approach speed | m/s | reaction leg | braking leg | required yellow |
|---|---|---|---|---|
| 25 mph | 11.18 | 1.0 s | 1.83 s | 2.83 s |
| 30 mph | 13.41 | 1.0 s | 2.20 s | 3.20 s |
| 35 mph | 15.65 | 1.0 s | 2.57 s | 3.57 s |
| 40 mph | 17.88 | 1.0 s | 2.93 s | 3.93 s |
| 45 mph | 20.12 | 1.0 s | 3.30 s | 4.30 s |
| 50 mph | 22.35 | 1.0 s | 3.67 s | 4.67 s |
| 55 mph | 24.59 | 1.0 s | 4.03 s | 5.03 s |
| 60 mph | 26.82 | 1.0 s | 4.40 s | 5.40 s |
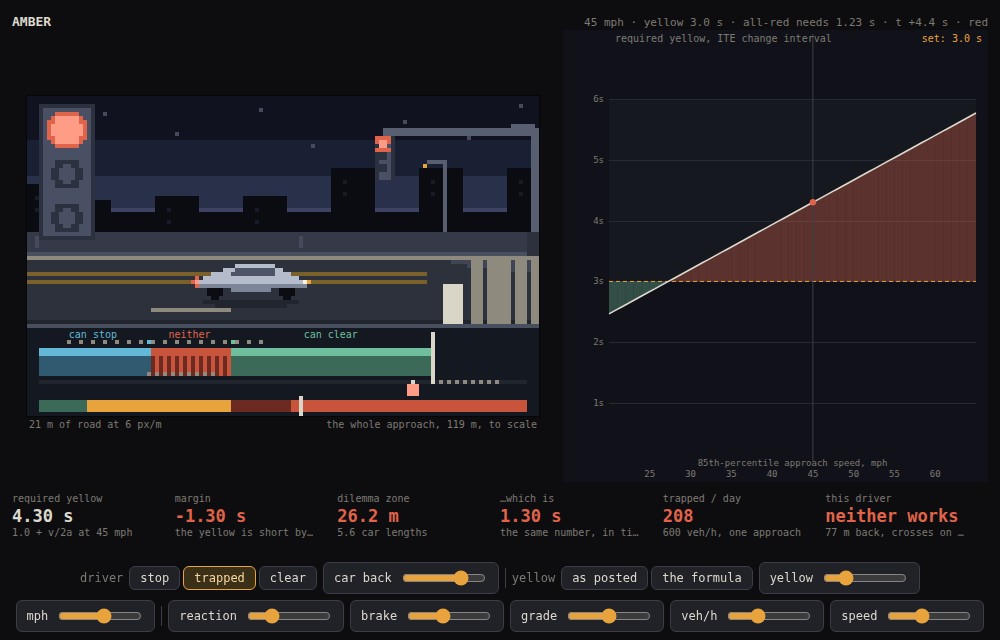
Note the shape: the reaction leg is a flat second and the braking leg is linear in speed, so required yellow is a straight line with a 1.0 s intercept. The demo draws it against whatever yellow you set, and shades the gap.
Now hold the yellow at three seconds — a legal number everywhere, because the national manual’s rule about this is a range, roughly three to six seconds, and not a formula — and walk the speed up:
| approach speed | set yellow | can clear within | can stop beyond | the band | car lengths | to cross it |
|---|---|---|---|---|---|---|
| 25 mph | 3.0 s | 33.5 m | 31.7 m | none | — | — |
| 30 mph | 3.0 s | 40.2 m | 42.9 m | 2.7 m | 0.6 | 0.20 s |
| 35 mph | 3.0 s | 46.9 m | 55.8 m | 8.9 m | 1.9 | 0.57 s |
| 40 mph | 3.0 s | 53.6 m | 70.3 m | 16.7 m | 3.6 | 0.93 s |
| 45 mph | 3.0 s | 60.4 m | 86.5 m | 26.2 m | 5.6 | 1.30 s |
| 50 mph | 3.0 s | 67.1 m | 104.3 m | 37.3 m | 8.0 | 1.67 s |
| 55 mph | 3.0 s | 73.8 m | 123.8 m | 50.0 m | 10.7 | 2.03 s |
| 60 mph | 3.0 s | 80.5 m | 144.8 m | 64.4 m | 13.8 | 2.40 s |
At 25 mph the two distances overlap and every driver has at least one way out — some have both. At 45 they have come apart by twenty-six metres, five and a half car lengths of road on which the only question is which violation you would prefer. At 60 it is sixty-four metres, on an approach whose yellow is barely half the 5.40 s it needs.
The identity, which is the whole piece
Run the same experiment the other way: hold the shortfall at exactly half a second and let the speed do what it likes.
| approach speed | required | set (half a second short) | the band | to cross it |
|---|---|---|---|---|
| 25 mph | 2.83 s | 2.33 s | 5.6 m | 0.50 s |
| 30 mph | 3.20 s | 2.70 s | 6.7 m | 0.50 s |
| 35 mph | 3.57 s | 3.07 s | 7.8 m | 0.50 s |
| 40 mph | 3.93 s | 3.43 s | 8.9 m | 0.50 s |
| 45 mph | 4.30 s | 3.80 s | 10.1 m | 0.50 s |
| 50 mph | 4.67 s | 4.17 s | 11.2 m | 0.50 s |
| 55 mph | 5.03 s | 4.53 s | 12.3 m | 0.50 s |
| 60 mph | 5.40 s | 4.90 s | 13.4 m | 0.50 s |
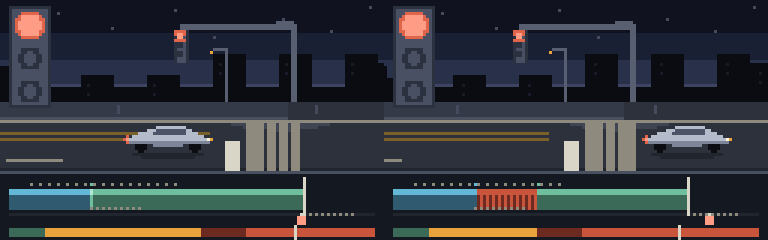
Or look at media/06-two-speeds.png, which is 25 mph and 55 mph side by side,
each half a second short. The approaches are 66 m and 145 m long and the bands
are 5.6 m and 12.3 m — and because each ribbon is scaled to its own approach,
the red lands in exactly the same place twice. That is what “the speed cancels”
looks like.
The last column does not move. The band more than doubles in length between the
first row and the last and it takes the same half second to drive through every
time, because both the band and the car scale with v and the ratio is a
difference of two times. So there is one number here, not two, and the useful
way to say it is in seconds: the dilemma zone is how short the yellow is.
That gives the model its sign convention. margin is set − required:
- positive — the two bands overlap by that many seconds. Every driver has a lawful action and the ones in the overlap have both.
- negative — that many seconds of every cycle during which arriving at this intersection is a citation, whatever you do about it.
There is no third case and no dead band in the middle. The two regimes meet at exactly zero, which is the point at which somebody set the yellow to the formula.
Both ways of being wrong are the same wrong
Pick the 45 mph approach with its three-second yellow and walk one driver back
along it. if they brake and if they keep going are the two things a real
person does, worked all the way through:
| where they are at yellow | able to | if they brake | if they keep going |
|---|---|---|---|
| 100.0 m back | stop | stops 13.5 m short | crosses at 4.97 s, on red |
| 90.0 m back | stop | stops 3.5 m short | crosses at 4.47 s, on red |
| 86.5 m back | stop | enters on red, 0.0 m in | crosses at 4.30 s, on red |
| 84.0 m back | trapped | enters on red, 2.5 m in | crosses at 4.18 s, on all-red |
| 78.0 m back | trapped | enters on red, 8.5 m in | crosses at 3.88 s, on all-red |
| 72.0 m back | trapped | enters on red, 14.5 m in | crosses at 3.58 s, on all-red |
| 66.0 m back | trapped | enters on all-red, 20.5 m in | crosses at 3.28 s, on all-red |
| 60.4 m back | go | enters on all-red, 26.2 m in | crosses at 3.00 s, on all-red |
| 55.0 m back | go | enters on all-red, 31.5 m in | crosses at 2.73 s, on yellow |
| 40.0 m back | go | enters on yellow, 46.5 m in | crosses at 1.99 s, on yellow |
Inside the band there is no column to be in. Brake — the correct instinct, the one the light is asking for — and you slide across the bar under red and come to rest somewhere in the middle of the intersection, which is both a violation and the single worst place on the road to be stationary. Keep going and you enter on red as well, just faster and further forward.
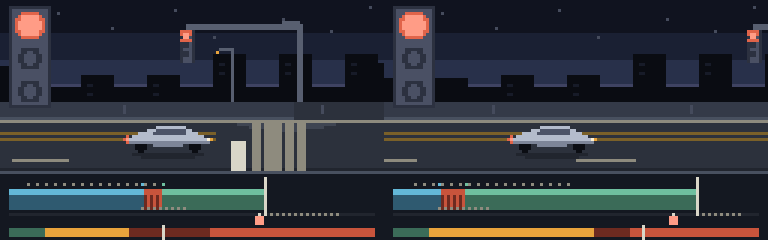
The trapped loop animates the first of those, because it is the one that
looks like obedience. Brake lights on, the car doing exactly what the signal
told it to, coming to rest ten metres inside the box with the cross street
about to be released.
Three ways to be short without meaning to
Grade. The formula has a grade term because gravity is part of the braking, and a downhill approach is the case everyone’s intuition already has. What is less obvious is how little grade it takes to undo a yellow that was computed correctly on the assumption of a level road:
| grade | effective braking | required yellow | against a 4.3 s setting |
|---|---|---|---|
| +6% | 3.64 m/s² | 3.77 s | 10.7 m of overlap |
| +4% | 3.44 m/s² | 3.92 s | 7.6 m of overlap |
| +2% | 3.24 m/s² | 4.10 s | 4.0 m of overlap |
| +0% | 3.05 m/s² | 4.30 s | 0.0 m of overlap |
| -2% | 2.85 m/s² | 4.53 s | 4.6 m of band |
| -4% | 2.66 m/s² | 4.79 s | 9.8 m of band |
| -6% | 2.46 m/s² | 5.09 s | 15.9 m of band |
| -8% | 2.26 m/s² | 5.44 s | 23.0 m of band |
Two percent — a slope you would not notice driving it — is enough to open a band on an approach whose yellow was computed to the formula.
The speed you put in the formula. The v in t + v/2a is supposed to be
the speed drivers are doing, the 85th percentile of the approach, which on a
typical arterial runs several miles an hour over the sign. Put the posted limit
in instead — an easy, defensible-sounding substitution, and a common one — and
the yellow is short for the majority of the traffic it is timing:
| posted | yellow set from it | 85th-percentile | yellow that needed | shortfall | the band |
|---|---|---|---|---|---|
| 25 mph | 2.83 s | 31 mph | 3.27 s | 0.44 s | 6.1 m |
| 30 mph | 3.20 s | 36 mph | 3.64 s | 0.44 s | 7.1 m |
| 35 mph | 3.57 s | 41 mph | 4.01 s | 0.44 s | 8.1 m |
| 40 mph | 3.93 s | 46 mph | 4.37 s | 0.44 s | 9.0 m |
| 45 mph | 4.30 s | 51 mph | 4.74 s | 0.44 s | 10.0 m |
| 50 mph | 4.67 s | 56 mph | 5.11 s | 0.44 s | 11.0 m |
The shortfall column is flat for the same reason the identity is flat: a fixed
6 mph of unmeasured speed is Δv/2a of missing yellow and nothing else. It is
0.44 s everywhere, on every approach in the network, silently.
Rounding and caps. Both of the above compound with an agency that rounds yellow to the half second and caps it at five, which is why the demo’s as posted button does exactly that and the the formula button does not.
What the band actually catches
Arrivals in free flow are stationary in time, so the cars whose time-to-bar at
yellow onset lands in a window of width Δ number, in expectation, λΔ — and Δ
is the shortfall. That makes the trapped rate linear in the missing yellow,
with no threshold below which shaving it is free:
| shortfall | per cycle | per day (90 s cycle) | per year | one approach, veh/h |
|---|---|---|---|---|
| 0.25 s | 0.042 | 40 | 14600 | 600 |
| 0.50 s | 0.083 | 80 | 29200 | 600 |
| 1.00 s | 0.167 | 160 | 58400 | 600 |
| 1.30 s | 0.217 | 208 | 75920 | 600 |
| 1.30 s | 0.108 | 104 | 37960 | 300 |
| 1.30 s | 0.433 | 416 | 151840 | 1200 |
A quarter of a second — one notch of rounding, an amount no driver could perceive and no engineer would defend a meeting over — is forty cars a day off one approach of one intersection, every one of them in a situation with no lawful exit. The arithmetic runs the other way too, and this is the part worth sitting with: adding a quarter second removes all forty, and the only thing it costs is a quarter second of capacity per cycle.
The all-red is a different question, and it is the easy one
The yellow decides whether you can be out of the dilemma. The all-red decides
whether the box is empty before the cross street is released, which is
(W + L)/v:
| approach speed | 20 m box | 30 m box | 12 m box |
|---|---|---|---|
| 25 mph | 2.21 s | 3.10 s | 1.49 s |
| 35 mph | 1.58 s | 2.22 s | 1.07 s |
| 45 mph | 1.23 s | 1.72 s | 0.83 s |
| 55 mph | 1.00 s | 1.41 s | 0.68 s |
It goes the other way from the yellow: faster traffic needs less all-red, because it gets out quicker. The two intervals are often spoken of as one lump of “clearance time,” which is how a long all-red gets used to justify a short yellow. They are not interchangeable. All-red protects the driver who is already committed. It does nothing whatsoever for the driver who has not reached the bar and cannot stop.
And a correct yellow does not fix everything
Everything above is the Type I zone, which is about what is physically possible and which the formula closes exactly. There is a second one, and it survives:
| approach speed | option zone | its width | required yellow reaches back |
|---|---|---|---|
| 25 mph | 27.9–61.5 m | 33.5 m | 31.7 m |
| 35 mph | 39.1–86.1 m | 46.9 m | 55.8 m |
| 45 mph | 50.3–110.6 m | 60.4 m | 86.5 m |
| 55 mph | 61.5–135.2 m | 73.8 m | 123.8 m |
The Type II or option zone is the band — conventionally between 5.5 s and 2.5 s of travel time from the bar — inside which drivers genuinely disagree with each other, the probability of stopping running from about one in ten at the far edge to about nine in ten at the near one. Two cars abreast, both lawful, one stopping and one not; and behind them, somebody who was reading the car in front rather than the light. It is drawn as the dotted rule above the bands in the ribbon, and note that it does not coincide with the Type I band at all — at 45 mph the option zone reaches 110 m back, well beyond the 86.5 m at which stopping becomes possible.
Nothing about the change interval addresses it. That is what advance detection is for: hold the green a moment longer so the platoon is never offered the choice. Different problem, different instrument, and the reason “just lengthen the yellow” is a complete answer to one question and not to the other.
The drawing
Two registers, and each one says what scale it is at, because they cannot be at the same one — the argument is eighty-six metres long and the frame is a hundred and twenty-eight pixels wide.
The scene is at 6 px/m: twenty-one metres of a four-lane arterial at dusk, with the car 28 px long because 4.67 m at that scale is 28 px, and that is the same 4.67 m the all-red calculation uses. Lane dashes are 3.05 m on a 12.19 m period (ten feet and thirty), the stop bar is 0.6 m of thermoplastic laid only across the lanes it binds, and the camera rides with the car until the last twenty metres and then holds still, so where the car ends up is a fixed frame rather than a pan.
The ribbon underneath is the entire approach to scale, on one axis, with the two bands drawn where they are: teal for the road you can still stop from, green for the road you can still clear from, and hatched red for whatever is left between them. The dotted tick inside the teal band is the reaction leg — 23% of the whole stop at 45 mph, travelled at full speed with nothing happening. Under it runs the signal’s clock, with a playhead.
The head hanging off the mast arm is, at 6 px/m, about a pixel and a half of lens, so there is an inset in the corner, about four times the scene’s scale, with lenses you can actually read. It is the one thing in the frame that is not drawn to scale, and it is there because for most of every loop the real head is off the left of the frame and the aspect is the one thing that must never be.
Reuse
source/amber.mjs is framework-free and has no canvas in it. Everything is SI;
MPH is the only unit conversion and PPM is the only thing that knows about
pixels.
stopDistance/goDistance/reactionDistance— the two distances and the leg that surprises people.requiredYellow(c)— the ITE change interval, grade and all.margin(c)is the signed seconds, and is the number to reach for first.zone(c)—{ near, far, len, seconds, cars, trapped }.lenis signed to matchmargin, so a negative length is an overlap rather than an error.requiredAllRed/optionZone— the other two intervals, kept apart from the first on purpose.verdictAt(c, d)→stop | go | either | trapped, andoutcome(c, d, choice)for the whole story of one driver including which aspect they cross under.driverAt(c, d0, choice, t)— closed-form position, speed and brake state. The reaction leg is in there as a held speed, not as a fudge ona.trapped(c)— expected vehicles caught per cycle, day and year at a flow.renderFrame(cfg)→ an indexed bitmap;paintBitmapputs it on a 2D context at an integer scale;ribbonAxis(c)is the same station→column map the bitmap used, exported so a caption can never point at the wrong band.validateGeometry()checks the story rather than the syntax: that the band in seconds equals the shortfall at four speeds, three grades and three yellows; that the ITE yellow closes it exactly; that the verdicts line up with the bands; that a trapped driver fails both ways; and that the trapped rate is exactly linear in the shortfall.
The demo is demo/index.html with its own copy of the module (ADR-0002). It
sizes itself to its viewport, so the site’s full-screen button just works.
What is derived here, and what isn’t
- Derived, and the drawing is built from it: both distances; the required
yellow; the band’s length in metres, car lengths and seconds; the identity
between the band’s crossing time and the yellow’s shortfall, which
validateGeometryasserts rather than asserting in prose; the grade term; the linear trapped rate; the all-red; where a braking driver actually comes to rest and which aspect they cross under. - Measured, not asserted:
scripts/measure.mjsregenerates every table above from the module.scripts/screenshot-demo.mjsboots the demo in a real browser, drives it, and checks fifteen assertions against the live page’s own readouts — that 45 mph needs 4.30 s, that 3.0 s is 1.30 s and 26.2 m short, that half a second short is half a second at 25 mph and at 45, that twice the shortfall traps twice as many, that a 6% downgrade undoes a correct yellow, and that the trapped driver is a violation whichever pedal they use. Any page error fails the run. - Chosen: the ITE values themselves — 1.0 s and 10 ft/s² are a convention about drivers, not a measurement of one, and the demo makes both sliders because moving them is the honest way to see how much of the answer they are; 6 mph as the gap between posted and 85th-percentile; a 20 m box, a 90 s cycle, 600 veh/h and a 4.67 m car; and the Type II zone’s 5.5 s and 2.5 s edges, which are a widely used convention rather than a property of anything.
- A model, not traffic: arrivals are stationary and independent, so the
trapped count is a clean
λΔ. Real arrivals come in platoons shaped by the upstream signal, which can put the whole platoon in the band or none of it, and the variance around that mean is the thing a coordination plan is actually moving. Queued vehicles are not at risk at all and are not netted out here, so the per-day figures are an upper bound on a busy approach and about right on a free-flowing one. - Not modelled, and it matters: every driver here has the same reaction time and the same braking, so the Type I edges are lines. In traffic they are distributions, which is exactly what makes the Type II zone a probability and not a bound — and it means a “closed” Type I zone still leaves the slower tail of drivers short. Wet pavement, a loaded truck’s much longer stop, and the driver who is following the car in front rather than the light are all out of scope and all make it worse.
- Not modelled, and it doesn’t matter to the lesson: brake system lag as distinct from perception-reaction; the jerk-limited ramp into full deceleration, which shifts the stop distance by under a metre at these speeds; permissive-yellow versus restrictive-yellow law, which changes what the violation is called but not where the band is; and right-turning traffic, which has its own geometry and its own argument.