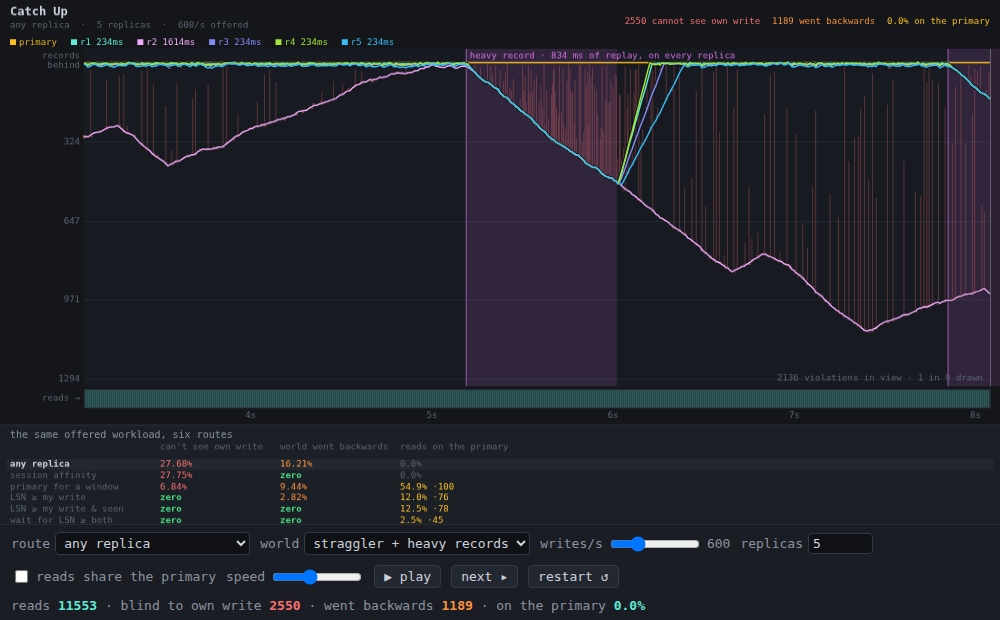
The usual drawing of read scaling is a fan: writes to the primary, reads out to the replicas, an arrow labelled async replication in between. Nothing in it is wrong and nothing in it says what a session is allowed to read, because the arrow is not instantaneous and the diagram never puts a number on it. What actually happens is that a session writes at the primary, reads a moment later from a replica, and is shown a world in which its own write has not happened.
So this is a simulator rather than an animation. An offered workload — when each write arrives, which session issued it, how long that session waits before each of its reads — is drawn once per seed. Then the same workload is replayed under six routers. Across 60 seeds the write stream is bit-identical and the read count is identical, so nothing below is a comparison between two different days.
Two guarantees, and each cheap fix buys exactly one
The thing worth counting separately is that “stale read” is two different bugs.
- Read-your-writes: a session fails to see its own last write. The user presses save, the page reloads, the change is gone.
- Monotonic reads: a session sees the world go backwards. The value was there, and now it is absent, and nobody deleted anything.
16 trials, 460,800 reads, five replicas, 600 writes/s offered:
| router | blind to its own write | world went backwards | reads on the primary | worst 100 ms | read p99 |
|---|---|---|---|---|---|
| any replica | 25.08% | 14.74% | 0.00% | 0% | 4 ms |
| session affinity | 25.27% | zero | 0.00% | 0% | 4 ms |
| primary for 500 ms after a write | 5.32% | 8.36% | 54.90% | 100% | 4 ms |
| LSN ≥ my write | zero | 3.42% | 10.91% | 81% | 4 ms |
| LSN ≥ my write and everything seen | zero | zero | 11.39% | 83% | 4 ms |
| wait for a replica with both | zero | zero | 2.05% | 56% | 404 ms |
Read the first two rows together, because they are the whole point.
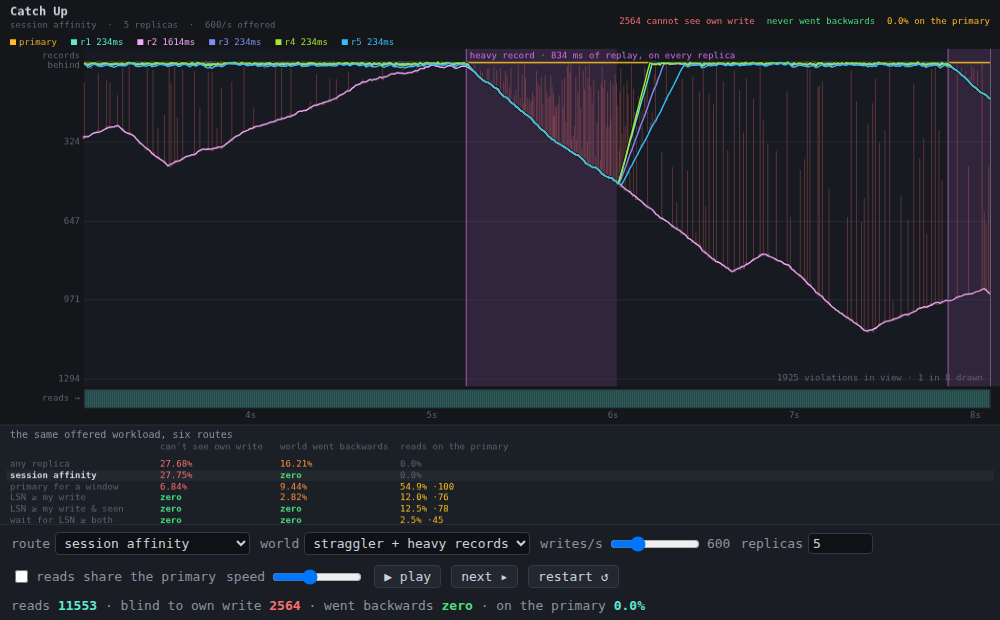
Session affinity is exactly zero on monotonic reads and buys nothing at all on read-your-writes — 25.27% against 25.08%, marginally worse than routing at random. It is zero for a structural reason: one replica’s applied position only ever increases, and a session’s reads are sequential, so it cannot be shown anything it has already been shown. And it is useless for the other guarantee for an equally structural reason: your write went to the primary, and your replica is a different machine that has not got it yet. Pinning a session to a replica does not pin it to its own data.
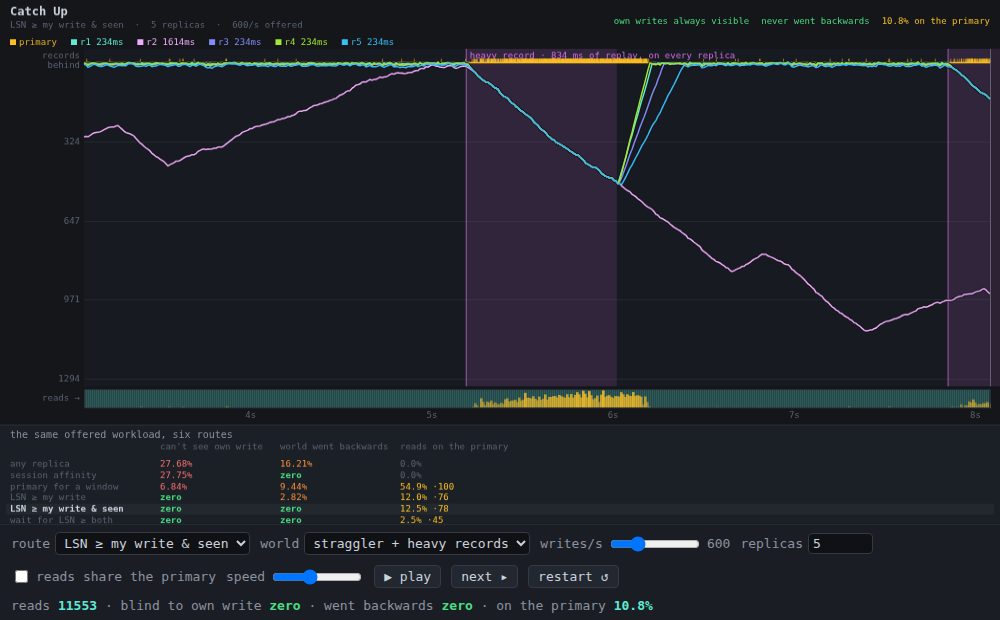
LSN routing does precisely the opposite. Require a replica that has applied your last write and read-your-writes is exactly zero, in every trial — a write is served only by a node whose applied position already passed it, so it is not a rate that got small, it is a quantity the comparison will not permit. And monotonic reads are still broken, 3.42%, because a session that happened to be shown record 9,000 by a fast replica is still allowed onto a replica sitting at 8,400: nothing in ”≥ my own write” mentions what it has been shown. Requiring both closes both, and costs 0.5 points of primary share.
Two orthogonal guarantees, two cheap fixes, each buying exactly the one the other misses. “Eventual consistency” names neither of them.
The middle row is the one people ship
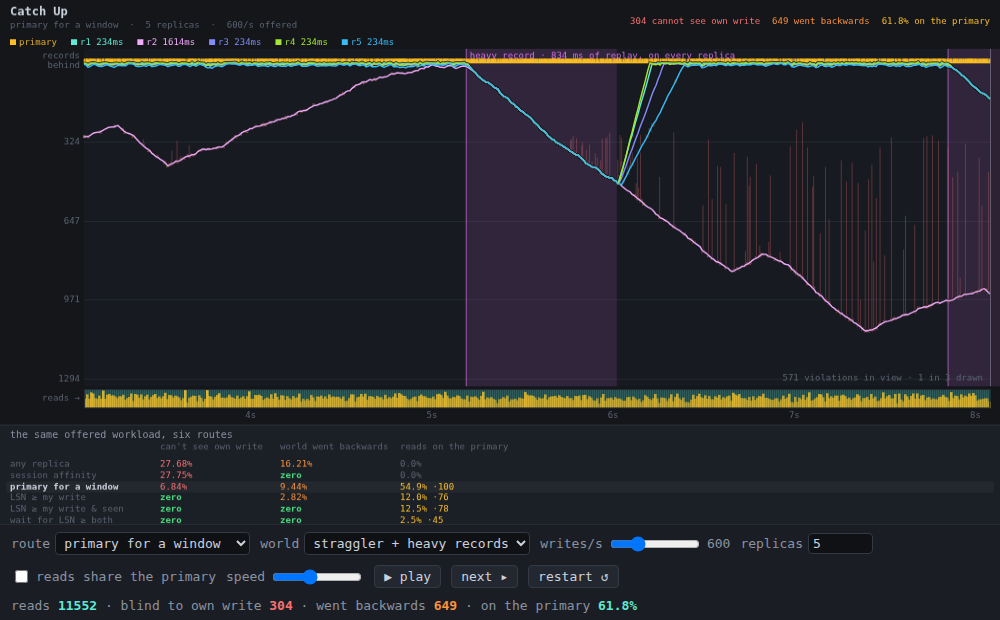
Reading the primary for a window after each write is the fix that gets written without a design document, and it is the only row that is expensive and still wrong: 54.9% of every read taken off the replica fleet, and 5.32% of reads still blind, because a time window is a guess about a quantity you are not measuring. When lag exceeds the window the guarantee silently lapses.
The dial has no good setting (600 writes/s, 8 trials):
| window | reads on the primary | blind to own write | went backwards |
|---|---|---|---|
| 0 ms | 0.00% | 24.57% | 14.10% |
| 100 ms | 19.43% | 15.82% | 15.15% |
| 250 ms | 36.89% | 9.77% | 12.00% |
| 500 ms | 54.74% | 4.98% | 8.10% |
| 1000 ms | 74.31% | 1.81% | 4.08% |
| 2000 ms | 90.48% | 0.31% | 1.17% |
| 4000 ms | 98.71% | 0.00% | 0.06% |
It does reach zero. It reaches zero at a setting that has taken 98.71% of the reads off the replicas, which is to say it reaches zero by not having replicas. Everything in between is paying most of the cost for part of the guarantee.
And note row two. A 100 ms window makes monotonic reads worse than having no window at all — 15.15% against 14.10%. It shows the session the front of the log and then takes it away, which is a violation the session would never have seen if nobody had tried to help.
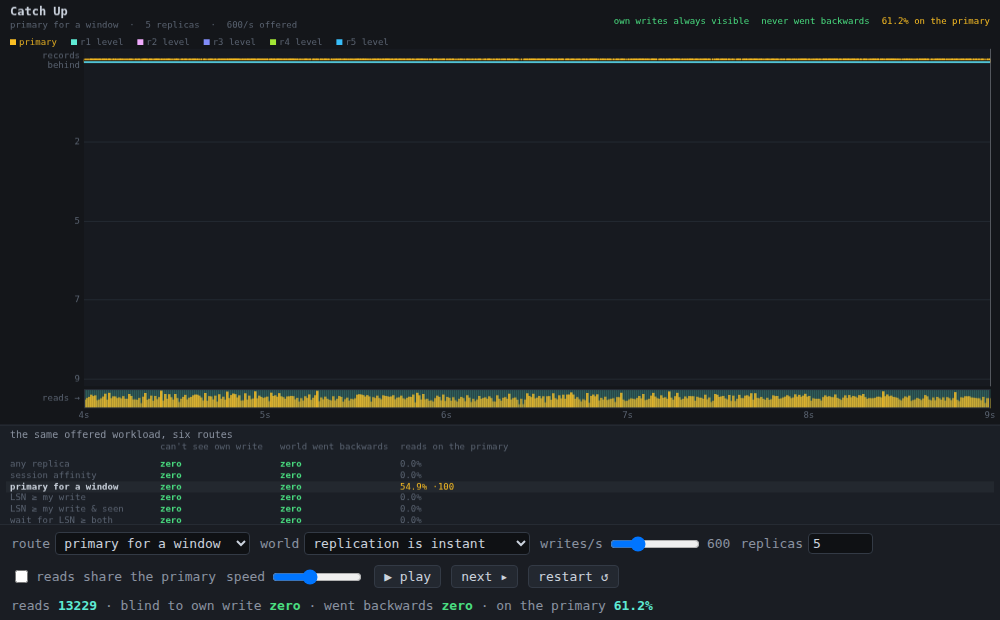
The control for all of this: set replication to instantaneous, where there is nothing to protect against and every router scores zero. The window still sends 54.9% of the reads to the primary. It cannot tell, because it never looks.
What the bill actually is
Every router here is a router, not a replica, so when no replica qualifies the read has to go somewhere. That is the number nobody configures and no dashboard shows, and it moves with load (6 trials per point):
| offered writes/s | lag mean | lag p99 | LSN router: reads on primary | worst 100 ms | peak reads/s at the primary |
|---|---|---|---|---|---|
| 200 | 116 ms | 860 ms | 7.84% | 77% | 460 |
| 600 | 315 ms | 2910 ms | 11.49% | 83% | 1600 |
| 1200 | 891 ms | 7437 ms | 18.92% | 92% | 3760 |
| 1600 | 1148 ms | 9234 ms | 25.87% | 95% | 4790 |
| 2000 | 1507 ms | 10246 ms | 35.51% | 98% | 6690 |
The primary in this simulation is one server rated at 4000 ops/s. At 1600 writes/s the correct, provably-zero-violation router asks it for 4790 reads/s in its worst 100 ms while it is also taking 1600 writes/s — 6390 offered against 4000. Nothing in the configuration says “send 4790 reads per second to the primary”. It is the arithmetic of a correctness rule meeting a lag distribution, and it arrives as a capacity event.
The average is not the number that hurts you. 11.49% mean against an 83% worst bin: the capacity plan reads the first and the outage is caused by the second.
Why the burst is a burst: replicas fail apart and together
Replicas fall behind for two different reasons and only one of them is diluted by buying more of them.
| world | blind reads (any replica) | lag mean | lag p99 | LSN router on primary | worst 100 ms |
|---|---|---|---|---|---|
| replication is instant | 0.00% | 0 ms | 0 ms | 0.00% | 0% |
| identical replicas, nothing wrong | 0.88% | 11 ms | 14 ms | 0.84% | 5% |
| unequal replicas, one straggler that stalls | 6.67% | 49 ms | 547 ms | 0.59% | 5% |
| …plus heavy records | 25.08% | 320 ms | 2640 ms | 11.39% | 83% |
A straggler is an independent failure: one replica is slow, the others are not, and a router only ever needed one healthy replica. A heavy record — one 200,000-row statement, one schema change — is a correlated one, because it is in the log, and every replica replays the same log, serially, while the primary committed it once with a parallel plan and hundreds of backends. (That asymmetry is the modelling assumption doing the most work here, and it is the one real systems actually have.)
So the decisive experiment is fleet size. 8 trials, 2 replicas to 6:
| world | blind reads, 2 → 6 replicas | LSN router’s worst 100 ms, 2 → 6 |
|---|---|---|
| identical replicas | 0.86% → 0.87% | 5% → 5% |
| straggler | 13.67% → 5.85% | 3% → 3% |
| straggler + heavy records | 42.67% → 22.85% | 83% → 83% |
Three readings, and the first is the one to take away.
With identical replicas, tripling the fleet changes the blind-read rate by 0.01 points. Replicas are read capacity. They are not freshness, and nothing about adding them makes the log arrive sooner. The only reason the middle row improves is that a bigger fleet dilutes one sick member — which is a real benefit and an entirely different one.
And the correlated burst does not move at all. 83% at two replicas, 83% at six. When the reason no replica qualifies is a record every replica has to replay, there is no Nth replica that is doing any better, so the fallback load is exactly the same however many you have bought. This is the answer to “we’ll add read replicas”: it buys throughput, it does not buy the guarantee, and it does not buy down the fallback spike.
The other bill: the primary is also committing the writes
Everything above gives primary-bound reads their own path. Let them share the one server with the write path instead (1400 writes/s, 8 trials):
| routing | reads on primary | write latency mean | write p99 | primary offered |
|---|---|---|---|---|
| any replica | 0.00% | 0.32 ms | 1 ms | 1400/s |
| primary for a window | 63.98% | 155.90 ms | 404 ms | ~4090/s, saturated |
| LSN ≥ my write & seen | 20.04% | 8.46 ms | 154 ms | ~2240/s |
A read consistency mechanism, with no write path in it anywhere, moved mean write latency from 0.32 ms to 155.90 ms — 487×. The window posture pushes the primary past its rating on reads that a replica could have answered if anyone had asked it whether it could.
But the honest version of this has a second half. The loop does not run away. Mean replica lag goes 1018 ms → 1000 ms when contention is switched on: the delayed commits do not measurably feed back into lag, because lag here is dominated by replay cost rather than by when the record was committed. The correct story is not a spiral. It is a conversion, at a bad exchange rate: your read load becomes write latency, which is a queue you never put it in.
Waiting, and what it costs
The last router does not fall back to the primary. It waits for a replica to catch up, and gives up only after a timeout (6 trials):
| wait budget | reads on the primary | reads that waited | timeouts | read mean | read p99 |
|---|---|---|---|---|---|
| 0 ms | 11.49% | 0.00% | 0 | 4.03 ms | 4 ms |
| 100 ms | 7.58% | 10.27% | 13106 | 12.88 ms | 104 ms |
| 400 ms | 2.09% | 8.14% | 3617 | 22.48 ms | 404 ms |
| 800 ms | 0.09% | 7.34% | 157 | 23.98 ms | 544 ms |
| 1600 ms | 0.00% | 7.31% | 0 | 23.95 ms | 534 ms |
It works, in the sense it claims: correctness stays exactly zero at every setting and the primary is eventually left entirely alone. What it does is move the bill from the primary’s capacity to the reader’s tail, and the shape is the dangerous part. Between 0 ms and 1600 ms the mean read goes 4.0 ms → 24.0 ms, six-fold, while the p99 goes 4 ms → 534 ms, 130-fold. On a graph of mean read latency almost nothing happened. The p99 has become the replica lag distribution’s tail, which is to say your read latency is now set by your slowest replica’s worst checkpoint, which is a thing you do not control and probably do not measure.
What’s on screen
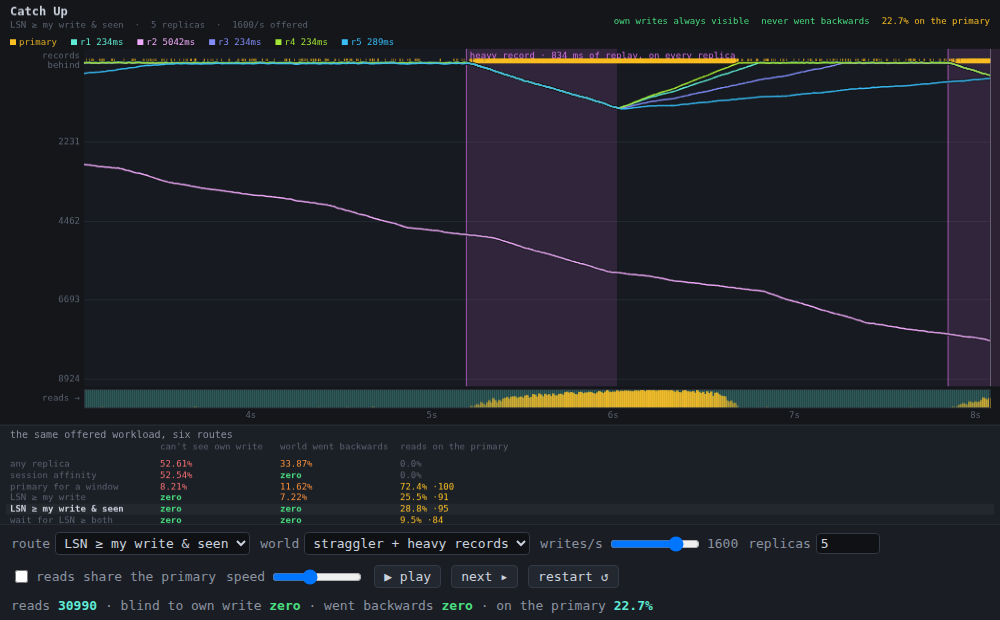
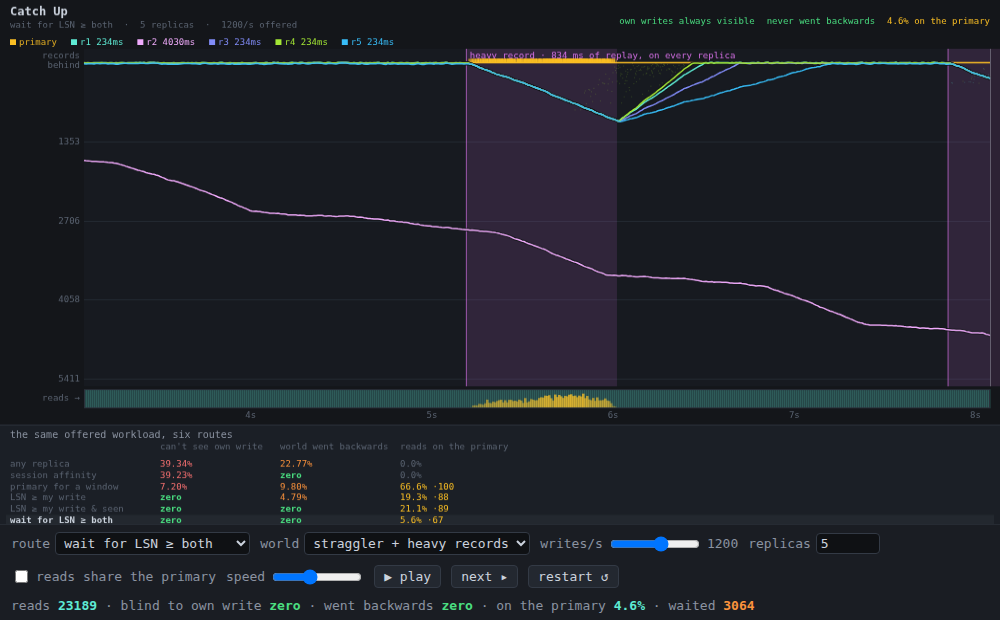
Time runs left to right in a five-second window; the playhead is a frontier, so nothing to its right is drawn.
- Y is how many records behind the primary a node is, growing downward. The primary is the flat line at the top, by definition — it is never behind itself. Every replica hangs below it. The gutter prints the same distance in milliseconds, which is the number a lag dashboard would show.
- the purple band is a heavy record entering the log, drawn from the instant it commits and as wide as the replay it costs. The dive is the thing to watch: every replica falls away together, on a slope set by the write rate, because they are all stuck behind the same record. Then they catch up at full apply rate, which is much faster than writes arrive, so the recovery is nearly vertical.
- a red mark is a read that could not see its own write, drawn at the depth of the record it needed with a stem down to where its replica actually was — so the violation is literally the distance between what was asked for and what was given. An orange mark is a read that went backwards. At a 25% violation rate a window holds thousands of these, so they are thinned to a readable density and the true count is printed beside them.
- the strip under the plot is where the reads went, binned per column: teal for a replica, amber for the primary. Under LSN routing at load it is teal, teal, teal, and then solid amber for exactly as long as the purple band lasts. That strip is the whole argument.
- the scoreboard carries all six routers on the same offered workload at all times, so the comparison never requires you to remember a previous run.
Notes
src/catch-up.mjsis framework-free and has no rendering in it: a primary that is one FIFO server, a replica that is one applier thread with a ship delay and a stall schedule, sessions that write open-loop and read sequentially, and one event queue over milliseconds.sweep,loadSweep,waitSweepandwindowSweepproduce every table above.- Every number in this write-up is read off the running demo by
scripts/screenshot-demo.mjs, which checks 70 claims on every build. Several are deliberately checks that something is nonzero, or identical across routes, because those are the claims that rot silently. - The router is given a perfect, instantaneous view of every replica’s applied position. No real one has that; it polls, or it reads a lag estimate that is itself stale. So the exact zeros here are an upper bound on how well this works, not a promise. The interesting consequence is that the bill is a lower bound for the same reason — a router with a stale view falls back to the primary more often, not less.
- A node answers with the state it has when the query reaches it, not with the state it will have when the answer lands. That is a half-RTT of pessimism applied identically to every node and every router, and it is what keeps the structural zeros exact rather than approximate.
- Sessions write open-loop and read closed-loop: the offered write stream is fixed by the seed and cannot be bent by a slow router, while a session’s second read genuinely waits for its first. That is what makes the read count identical across all six routers while their completion times differ, so every rate in the tables has the same denominator.
- Read gaps are log-uniform between 15 ms and 4 s. Uniform gaps would have buried the whole window question, because the only reads that can violate read-your-writes are the ones that arrive while the write is still in flight, and how many of those there are is a property of the workload rather than of the database.