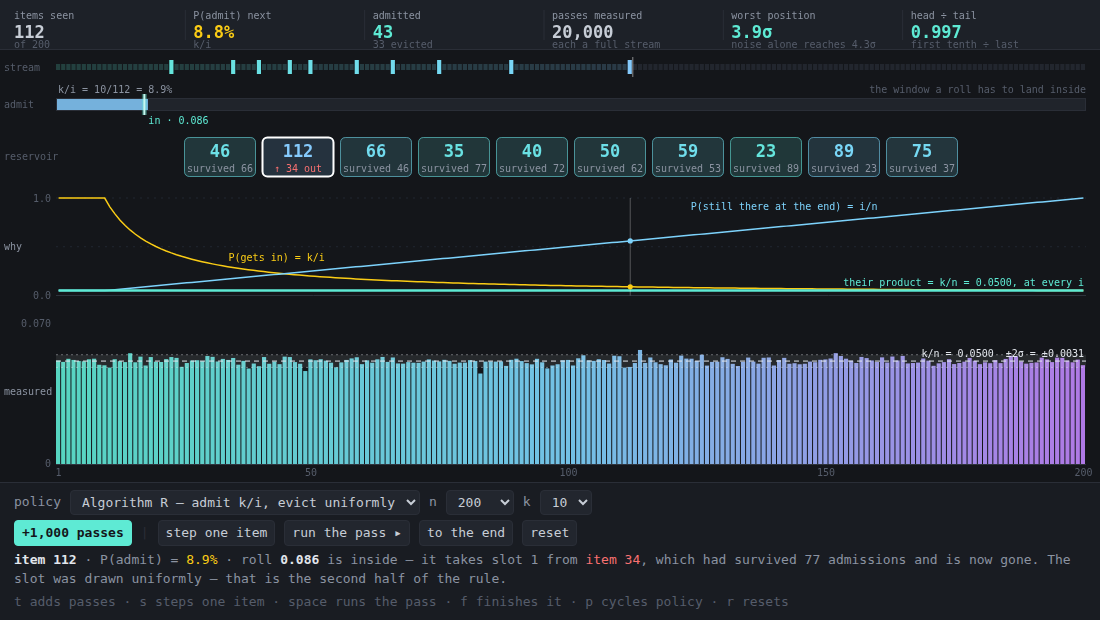
You are handed a stream of unknown length and k slots, one pass, no rewinding. Reservoir sampling says: let the first k in for free, then admit item i with probability k/i, overwriting a resident chosen uniformly at random. At the end, every item that went past is in your hands with probability exactly k/n — and you never needed to know n.
The part worth drawing is not the answer. It is that item 200 is admitted with probability 5% while item 11 is admitted with probability 91%, and they still come out even. Two quantities decay in opposite directions and the product is a constant:
- P(item i ever gets in) = k/i. The window closes as the stream grows.
- P(it is still there at the end) = i/n. Each later admission kills it with probability (k/j)(1/k) = 1/j, so surviving items i+1…n has probability Π(1 − 1/j) = i/n. The earlier you got in, the longer you were exposed.
(k/i)(i/n) = k/n, for every i. The why band draws both curves and then draws
their product pointwise rather than announcing it — a falling hyperbola, a
rising line, and a flat one underneath that never moves. Watch the right-hand
edge: at i = n the entry curve lands on the product line, because the last
item has no survival to do.
The measurement
One pass is one draw and proves nothing, so the bottom band is the experiment.
+1000 passes runs complete streams and tallies, per stream position, how
often it ended up in the final sample. The dashed line is k/n. The shaded strip
is ±2σ — the noise that the number of passes alone buys you — so a bar outside
it means something, and a bar inside it means nothing. The header prints the
worst position in units of that σ, next to the largest deviation you should
expect from n positions when nothing is wrong (~√(2 ln n), about 4.3σ for
n = 200). Bias and noise get told apart by eye rather than by vibes.
At n = 200, k = 10, 50,000 passes:
| policy | head ÷ tail | worst position | χ² (df 199) |
|---|---|---|---|
| Algorithm R | 1.007 | 3.2σ | 199 |
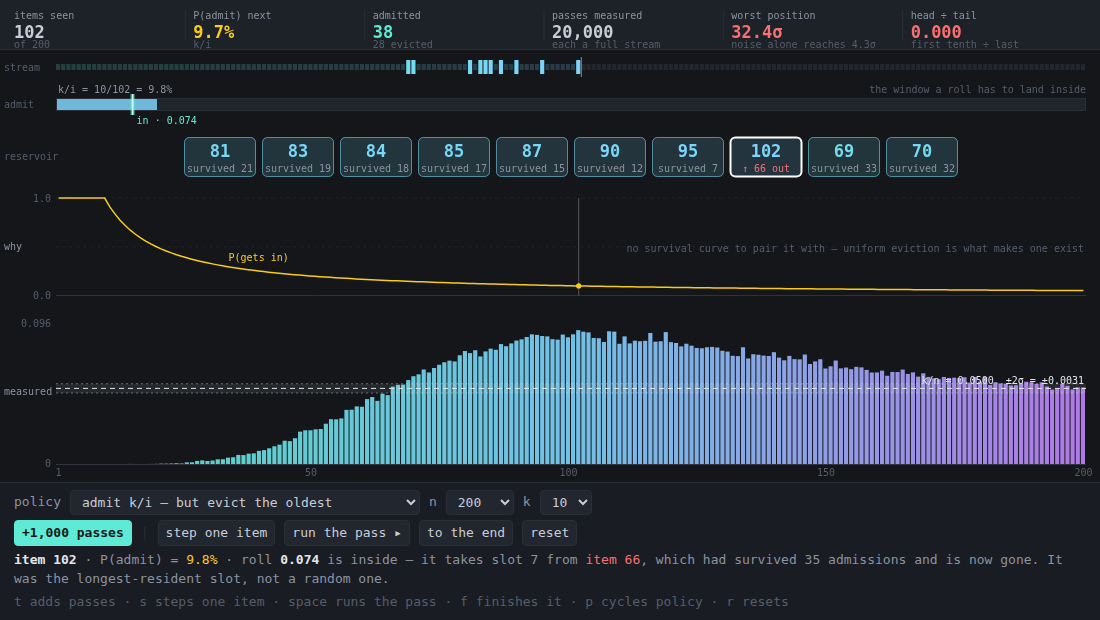
| admit k/i, evict the oldest | 0.001 | 51σ | 186,085 |
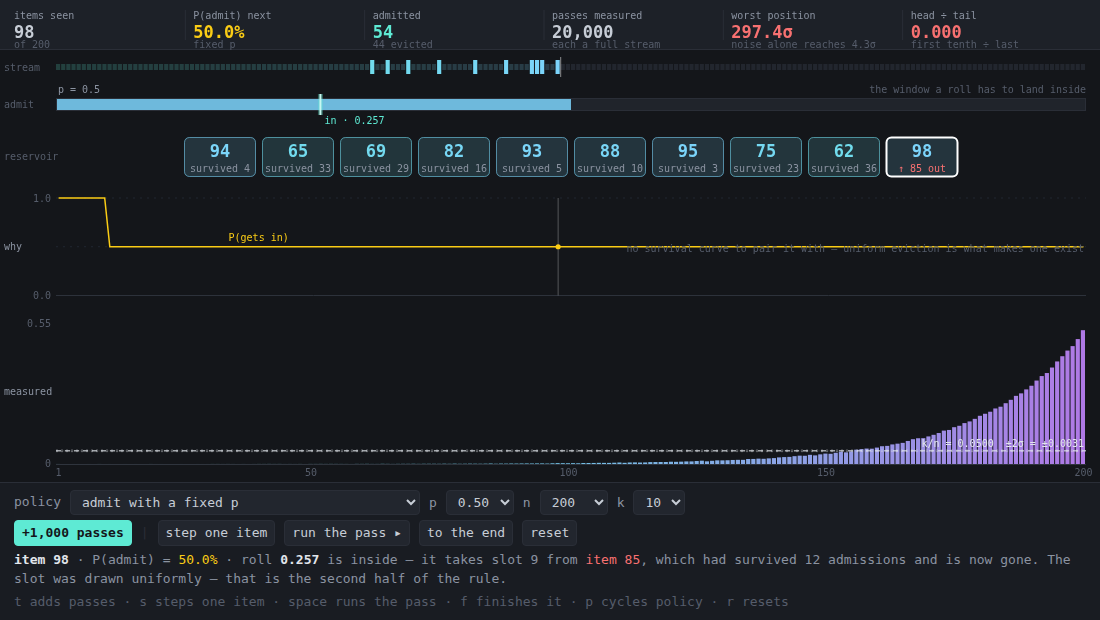
| admit with fixed p = 0.5 | 0.000 | 464σ | 2,174,643 |
| keep the first k | ∞ | 975σ | 10,000,000 |
χ² of 199 on 199 degrees of freedom is as flat as a measurement is allowed to get. The other three are not close, and the shape of how they miss is the interesting part.
The near-miss worth the whole piece
admit k/i — but evict the oldest is the one to spend time on. It computes the
admission probability exactly right. It is one line different from the
correct algorithm, it is the line a reviewer’s eye slides over, and its
histogram is a hill: the first tenth of the stream is at 0.00 of k/n, the
middle peaks at 1.68×, and the tail settles back near 1.05×. Not “prefers
recent data” — something stranger, because early items are evicted in
guaranteed order while late items never get the chance to be old.
Uniform eviction is a second requirement, not an implementation detail of the
first. That is why the why band refuses to draw a survival curve for any
policy but Algorithm R: without uniform eviction there is no clean i/n to pair
the hyperbola with, and the identity that makes the thing work simply does not
exist.
The other two failures are loud by comparison. A fixed p ignores the length of the stream and the last decile ends up at 6.4× its share. Keeping the first k is the one everybody knows is wrong, and it is here so the histogram has a cliff in it for scale.
Reading the picture
- Colour is position. Early items are teal, late ones purple, and the same ramp is used in the stream strip, the reservoir slots and the histogram bars. A uniform sample is a spread of hues in the slot row; a biased one is all of one end. You can call the failure before the histogram has finished.
- The
admitbar is the window a roll has to land inside. It visibly shrinks as i grows — that is k/i, in the units the decision is actually made in — and the tick is the draw. - Slots print what they have survived. A resident that has lived through 107 admissions is the survival curve’s other face.
- Every policy puts exactly k items in the reservoir, so the total is right in all five cases and the mean is exactly 10. The mean is not the test.
Controls: policy, n (60 / 200 / 1000), k (1 / 4 / 10 / 25), and p for the
fixed-probability policy. t adds passes, s steps one item, space runs the
pass, f finishes it, p cycles policy, r resets. Click a slot for its
history and its measured inclusion rate. Try k = 1, n = 1000: one slot, a
0.1% window by the end, and the histogram still flattens.
Reuse
src/reservoir.js is a framework-free ES module. Mutating calls return a trace
rather than a bare answer, because the probability a policy used and the roll
it made are the interesting part:
create(n, k, { policy, p, rng }),step(state),runToEnd(state),done(state).stepreturns{ i, filling, p, roll, admitted, slot, evicted, survivedRolls, reason }.reasonis a sentence, so a UI can quote the rule instead of restating it.sample(state)— positions held, ascending.membership(state)— a 0/1 array over the whole stream, which is what a strip renderer wants.runTrials(n, k, policy, count, { p, rng, counts })— untraced passes that accumulate into a tally, so batches add up instead of replacing each other.readTally(tally, { n, k, trials })—{ target, freq, sigma, worstSigma, worstAt, headTail, mean }.theory(n, k)—{ target, enter, survive, inclusion }, andexpectedCurve(n, k, policy)for the policies with a closed form (it returnsnullfor the two that don’t have one, on purpose).bucket(freq, n, cols),mulberry32(seed),POLICIES,POLICY_NAMES.
Gotchas
POLICIES[p].admit(state, i)is called with a 1-indexediand only fori > k; the fill phase is handled before any policy is consulted. A policy that returns > 1 or < 0 is clamped rather than trusted.runTrialstakescountsand adds to it. Passing a tally from a different (n, k, policy) silently averages two experiments — the demo throws its tally away on every config change for exactly this reason.sigmainreadTallyis the binomial error on k/n at that many passes, and positions are not quite independent (each pass holds exactly k of them), so treatworstSigmaas a strong indicator and χ² as the real test.stepconsumes one item; there is no putback.runToEndon a fresh state is the fast path, but it still walks every item, because the point of the algorithm is that it only ever sees each one once.- The demo bundles its own copy of
reservoir.js(self-contained by contract); re-copy it after editingsrc/.