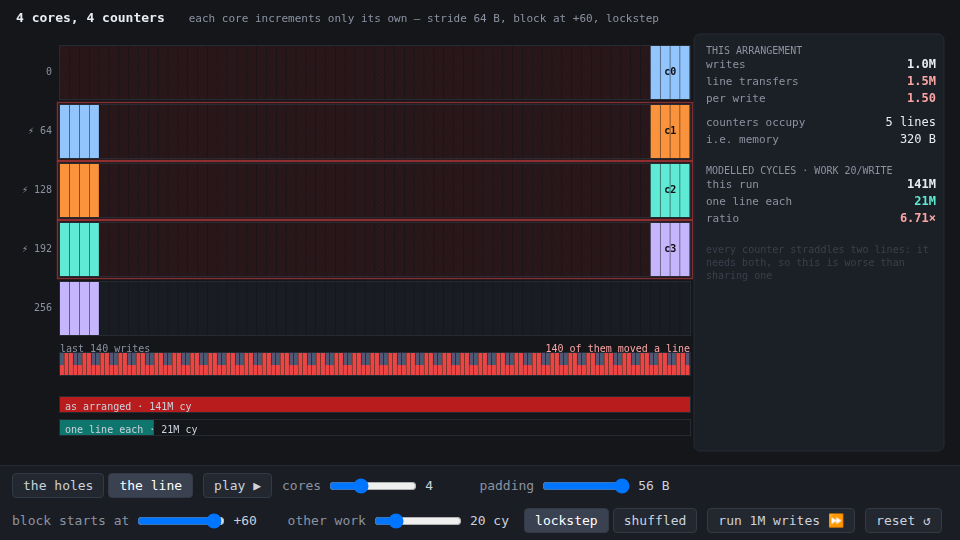
Two panels, one word. In the first, padding is bytes you are paying for and did not ask for. In the second, padding is the bytes you should have asked for and didn’t. It is the same hatched red in both, on the same shelf of 64-byte cache lines, and nothing about the picture tells you which one you are looking at. The controls do.
The holes
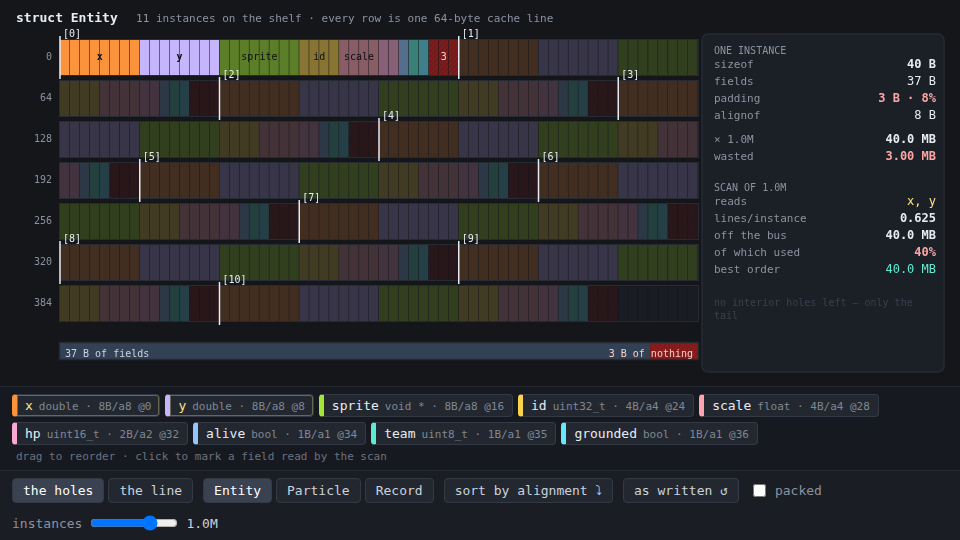
struct Entity is written the way people write structs: fields grouped by what
they mean. A liveness flag, then a position, then a team, then the other half of
the position. The compiler is not allowed to help. C lays members out in the
order you declared them — that is in the standard, not a quality-of-implementation
matter — so all it can do is insert enough dead bytes before each field to land
it on its own alignment.
It inserts 27 of them.
37 bytes of fields. sizeof 64. Four interior holes — 7 bytes before x,
7 before y, 6 before sprite, 3 before scale — and then 4 more at the end,
which is the one nobody predicts. Tail padding exists so that the next element
of an array starts aligned too, which is why struct { int a; char b; } is 8
bytes and not 5, and why you cannot shrink a struct by deleting its last field.
Drag the chips into descending alignment and it goes to 40 bytes, with three bytes of tail and no interior holes at all. Same nine fields, same types, same program. At a million entities that is 64.0 MB against 40.0 MB; the counter runs to 6.40 GB against 4.00 GB if you push the instance slider to a hundred million.
The greedy order — biggest alignment first — is not a heuristic here, it is optimal, and for a boring reason: every one of these alignments divides every larger one, so descending order can never leave an interior gap. Put a 3-byte field or an oddly-sized nested struct in the mix and that stops being true.
Two things fall out of it that the memory saving doesn’t cover:
The array gets shorter, so the scan gets cheaper. Click x and y to mark
them as what a hot loop reads. At 64 bytes per entity, a linear pass touches
1.000 cache lines per entity and uses 25% of each one — it is dragging 64
bytes across the bus to look at 16. At 40 bytes it is 0.625 lines per entity
and 40% used: 40.0 MB off the bus instead of 64.0 MB, for the identical loop.
Reordering fields is a bandwidth change, not just a footprint change.
But 64 was doing something. At sizeof 64 every instance is its own cache
line, perfectly, and the shelf shows it: seven instances, seven rows, every
boundary flush. At 40 they straddle. Touch one entity at random and you now
sometimes pay for two lines instead of one. The shorter struct wins the streaming
scan and loses the random poke, and the piece will not tell you which one your
program does.
packed is on the bar as the third option, and it is there to be discounted.
It gets Entity to 37 bytes — the true payload, zero holes — at the price of
every alignment guarantee in the struct. On x86-64 that is a slower load. On
plenty of other targets it is a fault, and taking a reference to a field of a
packed struct is undefined behaviour besides.
The line
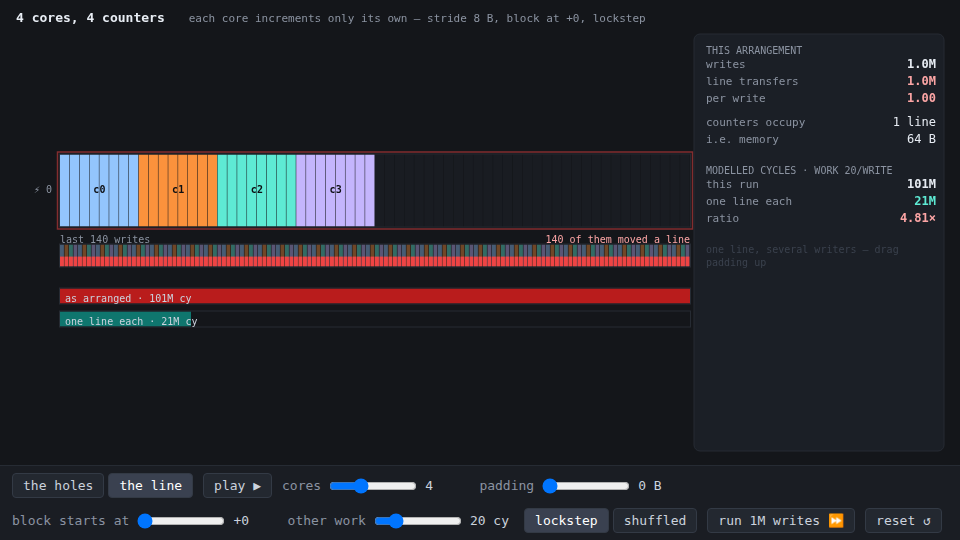
Second tab, same shelf. Four cores, four counters, each core incrementing only its own — no locks, no shared variable, nothing that looks like contention in the source. The counters are eight bytes apart because why would they not be.
One million writes. One million line transfers. One per write, and the tape under the shelf is solid red the whole way: every single increment took the line away from whichever core had it last. There is no data race here and no wrong answer at the end; there is just a 64-byte line being dragged between four private caches a million times, because coherence is enforced per line and the hardware has no idea your counters are unrelated.
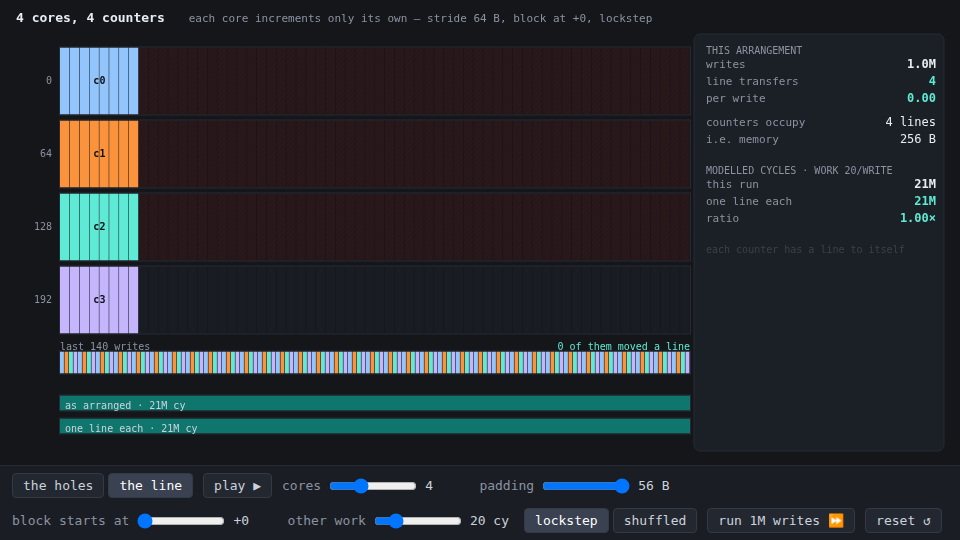
Drag padding to 56 bytes and the number goes to 4 — one cold miss per core, and then nothing, forever. The tape turns clean. The stats line that matters is the honest one underneath: the fix costs 256 bytes instead of 64, and 192 of those bytes are hatched red and will never hold anything.
The modelled cycles put a ratio on it, and the constants are printed beside it because they are doing all the work: a hit is 1, a transfer is 80, and “other work” is what each core does between its own writes. At 20 cycles of other work the shared version is 4.81× slower. Drag other work to 0 and it is 81×; drag it to 100 and it is 1.79×. False sharing is not a fixed tax, it is a ratio against how much real work you were doing — which is exactly why it shows up in profile-free microbenchmarks and in tight atomics loops and much less in whatever else you were worried about.
Two more results worth the drag:
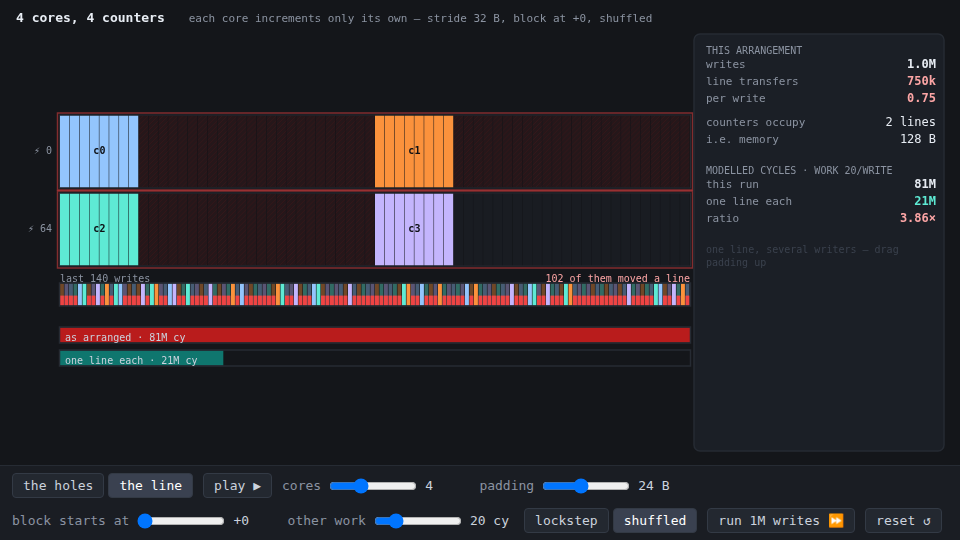
Half the sharing buys almost nothing. Stride 32 puts two counters per line instead of four. Under the shuffled interleave — the honest one, where cores write in random order rather than strict rotation — full sharing costs 0.938 transfers per write and half sharing costs 0.750. You removed half the contention and 20% of the transfers, and the modelled ratio goes 4.57× to 3.86× — a fifth of the way back to 1. Padding is not a dial; a line is shared or it isn’t.
Padding without alignment is worse than no padding at all. Set stride 64 and
then slide the block’s start to +60. Every counter now straddles two lines, and
a write needs both of them exclusive: 1,500,002 transfers on a million
writes, 1.50 per write, 6.71× — against 4.81× for the version with no padding
whatsoever. Five lines and 320 bytes spent to make it worse. This is why the
idiom is alignas(64) and not char pad[56]: the padding controls the distance
between counters and the alignment controls where the first one lands, and only
the second one is a guarantee.
Reuse
src/layout.js is a framework-free ES module, no dependencies, no DOM.
layout(fields, {packed})— offsets, holes (tail flagged separately), size, align, payload, padding.optimalOrder(fields)is the descending-alignment sort.traffic(size, reads, count)— cache lines a scan over an array touches, and the fraction of the fetched bytes it actually wanted. Counted by period rather than simulated: after64 / gcd(size, 64)instances the access pattern repeats shifted by a whole number of lines, and a period block owns its lines exclusively, so counting one block and multiplying is exact at any count.Coherence— write-invalidate coherence with the two states a write-only workload ever visits.write(core)returns how many lines had to change hands;run(rounds, {shuffled, seed})picks the interleave.blockFootprint()is the space side of the trade.TYPES/field()/PRESETS— the System V AMD64 scalar table and three structs to lay out.
scripts/screenshot-demo.mjs drives the demo through window.__demo and takes
a frame; --shot=holes|sorted|shared|padded|partial|straddled picks which
sentence of the argument to capture.
Gotchas
Rust already does the first panel for you. repr(Rust) is explicitly
unspecified and rustc reorders fields by alignment; you only get the hand-written
order back by asking for #[repr(C)], which is the same request as ABI
compatibility. So the whole first tab is a C and C++ problem by construction, and
an opt-in one everywhere else. If you want the compiler to nag you about it,
-Wpadded on clang and gcc reports every hole it inserts, and pahole prints
the map for an already-built binary.
64 is not a constant, it is this machine’s constant. x86-64 and most AArch64
parts use 64-byte lines; Apple’s silicon uses 128. Hard-coding 64 in your padding
gives you a struct that is right on your laptop and half-wrong on somebody’s.
C++17 spells the correct answer std::hardware_destructive_interference_size,
and the JVM spells it @Contended, and both exist because the number moved.
The cycles are modelled; the transfers are not. Line transfers are exact under the coherence rule — a write needs its line exclusive, taking it exclusive takes it from whoever had it — and that rule is really how it works. Everything in cycles comes from one constant on a slider. Read the ratio, do not quote the number, and do not expect a real machine to hit 81× at zero other work: a real core has store buffers and out-of-order execution and will hide some of it.
The interleave is a model choice with teeth. Lockstep is the worst case by construction — no two consecutive writes from the same core, so every shared line moves every time, and it is the only reason the headline reads a flat 1.00 per write. It is also the mode in which stride 32 looks no better than stride 8, which is an artifact. The shuffled mode is what the partial-sharing claim above is measured in, and it is the one to trust when the arrangement is anything other than all-in or all-out.
The real fix for the scan is not in either panel. If a loop reads x and y
and nothing else, the answer is not a better field order, it is struct-of-arrays:
two flat double[] and 100% of every line used. Reordering takes the Entity scan
from 25% to 40%; splitting the hot fields out takes it to 100%. The first panel
is the fix that costs you nothing and changes no code that reads the struct,
which is why it is worth knowing — not because it is the best one available.
Nothing here models the allocator. malloc hands back 16-byte-aligned memory
on most 64-bit platforms, so a block of 8-byte counters never actually straddles
a line by accident; the +60 case needs a packed struct, a hand-carved offset into
a buffer, or a deliberate mistake. It is in the piece because it is the failure
mode of the fix, and the fix is the thing people apply half of.