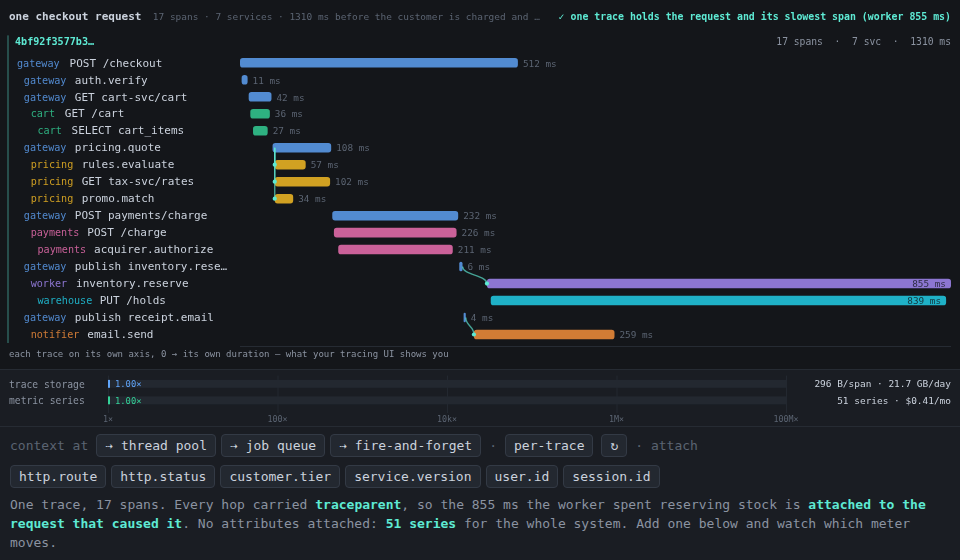
One POST /checkout, seventeen spans, seven services. The gateway checks auth,
loads a cart, fans a pricing quote across a thread pool, charges a card,
enqueues a stock reservation, and fires a receipt email at a notifier nobody
waits for. From the customer’s side it is over when the stock is actually held:
1310 ms.
Three of those edges leave the thread that started them — a pool worker, a job queue, a fire-and-forget publish — and each is a place where trace context has to be serialised and carried rather than inherited. Click a boundary to drop its context and watch what happens.
Nothing happens. That is the finding.
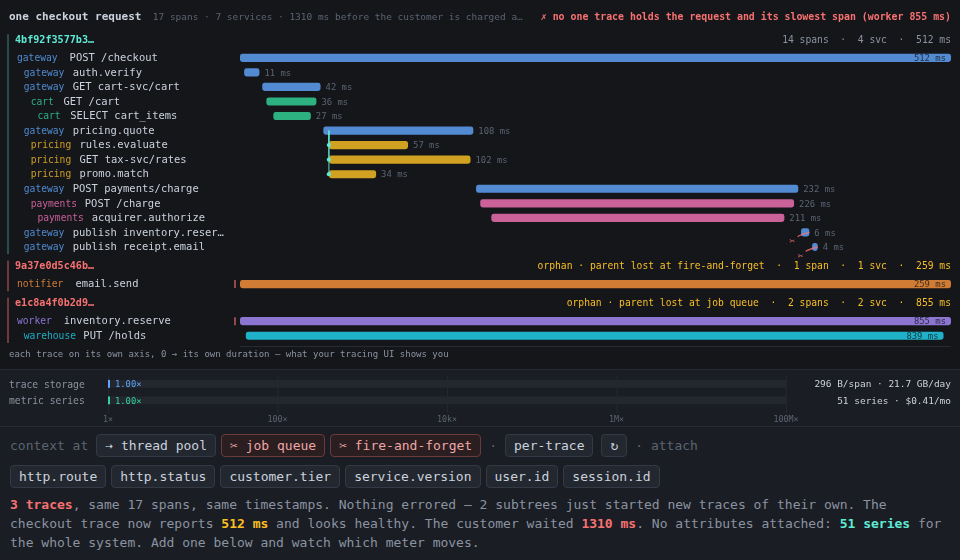
No span disappears. No timestamp moves. No error is raised anywhere, by
anything. The only thing that changes is which trace_id a subtree carries,
and so the picture reorganises itself into two traces, then three, then six —
each one internally coherent, each one a plausible thing to find in your
tracing UI on a Tuesday.
The checkout trace now reports 512 ms and looks healthy. It is not wrong: the gateway really did return in 512 ms. It is just no longer the answer to the question you asked, because the 855 ms the worker spent reserving stock is now the root of a trace of its own, with no customer on it, no route, no cart, and nothing pointing back. The header keeps score: does one trace hold the request and its slowest span? Cut the queue boundary and it flips to ✗ and stays there, quietly, forever.
That is the actual failure mode. Broken instrumentation announces itself — spans stop arriving, the service vanishes from the map, someone files a ticket. Broken propagation looks exactly like a healthy system with more traces in it.
The alignment toggle
By default every trace block is drawn the way a tracing UI draws one: its own axis, running 0 → its own duration. Under that convention the orphaned worker trace is a fine-looking 855 ms job, drawn the full width of the panel, sharing no visual relationship with the request that caused it. The dropped thread is rendered as it actually exists — a stub leaving the parent, fraying, and stopping; the two ends genuinely are on unrelated rulers, so no line is drawn between them.
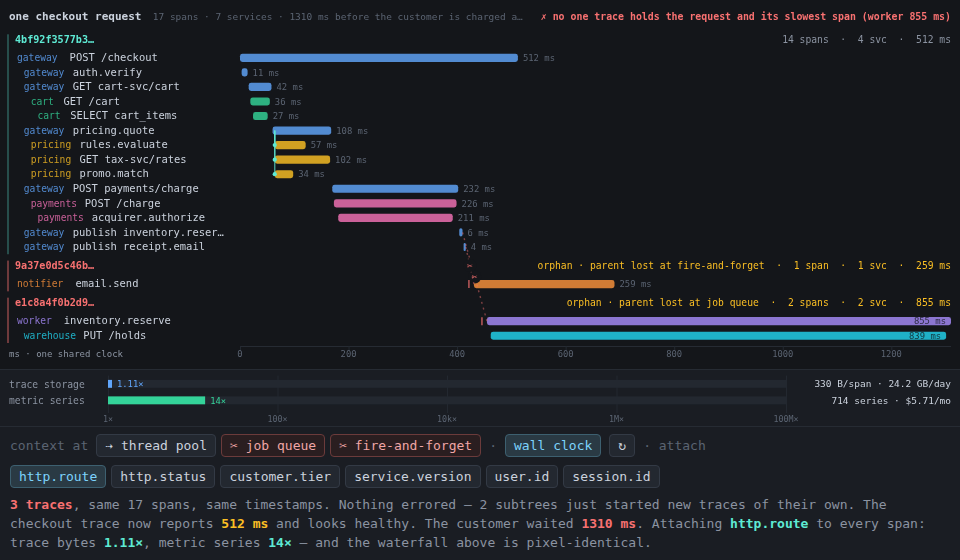
Switch to wall clock and every trace lands on one shared axis. The request ends at 512, the worker runs to 1310, the two overlap for exactly as long as they overlap, and the dashed red edge across the gap is the parent-child relationship that exists in the world and not in your trace store. That picture is the one you want. It is also the one you cannot draw, because drawing it requires the context you dropped.
The other dial
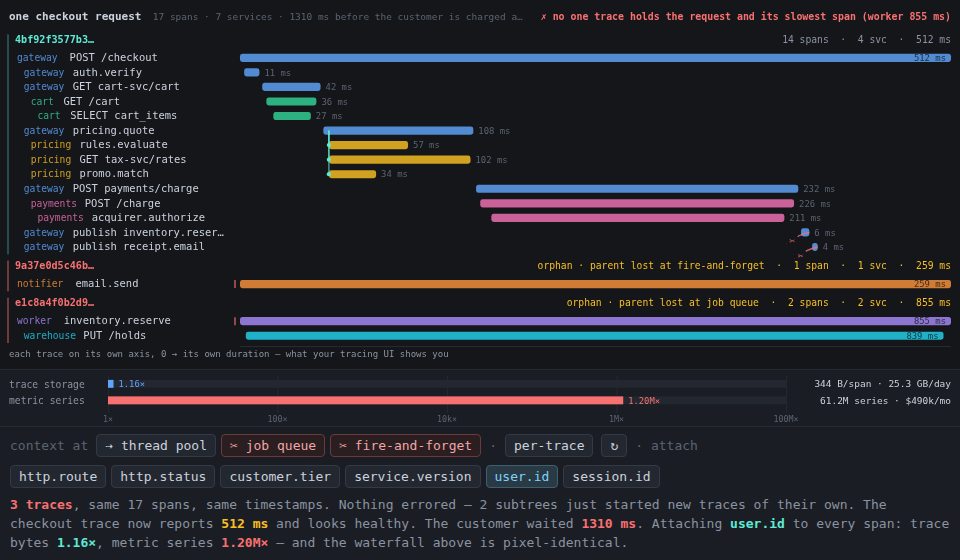
Six attributes along the bottom, each one attached to every span. The waterfall does not change — not a pixel, in any configuration. Two meters underneath sit on one shared log axis from 1× to 100M×, because putting them on separate scales is how this bill gets missed:
- Trace storage is linear. Bytes per span go from 296 to 344 when you
attach
user.id; storage goes 21.7 → 25.3 GB/day. It moves 16%, and it is the meter everyone watches. - Metric series is a product. The span-metrics pipeline derives RED metrics
from spans, one series per operation per status — 51 series for this entire
system — times every distinct combination of the dimensions you attached.
user.idalone takes that to 61.2M series, about $490k/month at a common $8/1k-series rate.
That is a 1,200,000× move on a picture that did not change, and it happens for
two compounding reasons. The pipeline is a product, so attributes multiply
rather than add: http.route and customer.tier together cost 14 × 4, not
14 + 4. And span-derived metrics are computed before sampling, so the 10%
head sampling protecting the trace bill does nothing at all for this one.
Turn on session.id as well and the number stops climbing — not because
anything got better, but because it hit the only ceiling there is: you cannot
mint more series in a day than you emit spans. The meter says capped by span rate when you are there. It is not a safety feature.
The rule that falls out
An attribute belongs on a span if you would ever filter a trace search by it,
and belongs in the metrics pipeline only if you would ever group a dashboard
by it. user.id is squarely the first and catastrophically the second — which
is why the OpenTelemetry Collector lets you configure the spanmetrics
connector’s dimensions separately from what the SDK records. Two lists, and the
default is to conflate them.
Reuse
src/propagate.js is a framework-free ES module — no DOM, no timers, no
rendering:
SPANS,BOUNDARIES— the hand-authored trace and its three async edges, each boundary carrying the specificcauseby which it drops in practice (thread-locals, job payloads that carry arguments but not headers, and nothing to await).partition(droppedIds)— the whole model of the failure: returns one entry per resulting trace, marking the ones that are roots by accident. It never adds, removes, retimes or reorders a span, which is the property the piece is built on.traceStats(trace),slowestSpan(),answersWhySlow(traces)— the header numbers, including the one question worth asking of a partition.costs(enabledAttrIds, opts)— both pipelines: bytes per span and stored trace volume, plus derived series, series cost, and whether the estimate hit the span-rate ceiling.DEFAULTSholds every rate it assumes, so change the traffic or the sampling and the meters follow.distinctSeen(card, draws)— expected distinct values observed indrawsuniform draws from a population ofcard, so the series estimate is what the traffic can actually generate rather than a raw product of cardinalities.
Gotchas
- The dollar figure is an order of magnitude, not a quote. It is series ÷ 1000 × $8/month, which is roughly where managed metrics list prices sit; every vendor bills differently and most negotiate. The ratio between the two meters is the durable part, and the ratio is not sensitive to the rate.
http.routeis double-counted here, slightly. Every span name in this trace is already unique per operation, so in a real spanmetrics setup the route dimension would overlap with the operation dimension and add much less than its 14×. The model multiplies it anyway, because the mechanism it demonstrates — dimensions multiply — is the thing worth having in your hands. The attributes that matter to the punchline (user.id,session.id) are genuinely orthogonal to operation.- Tail sampling would change the trace meter, not the metric meter. Moving from 10% head to a tail policy changes what fraction of spans get stored; it does not touch a pipeline that runs on 100% of spans upstream of the sampler.
- A real dropped context is rarely all-or-nothing. Here a boundary either propagates or does not. In practice one code path in a queue consumer restores the context and another does not, so you get a trace that is intact for 80% of traffic and split for the rest — which is worse, because the aggregate looks fine.
- Links are not modelled. OpenTelemetry span links exist precisely to express “caused by, but not a child of” across an async boundary, and would let the orphaned worker point home without inheriting the parent’s trace. Nothing here draws them; the piece is about what happens when there is no edge at all.
- The demo bundles its own copy of
propagate.js(self-contained by contract); re-copy after editingsrc/.
Keys: 1 2 3 toggle the boundaries, w swaps alignment, r replays the
assembly.