A virtual address on x86-64 is 48 bits split 9 / 9 / 9 / 9 / 12. The four nine-bit fields are indices into four tables, each one a 4 KiB frame holding 512 eight-byte entries; the twelve are the byte inside the page. So a load that the hardware cannot shortcut is not one memory reference. It is four table reads and then the one you asked for, and the TLB exists so that the first four do not happen.
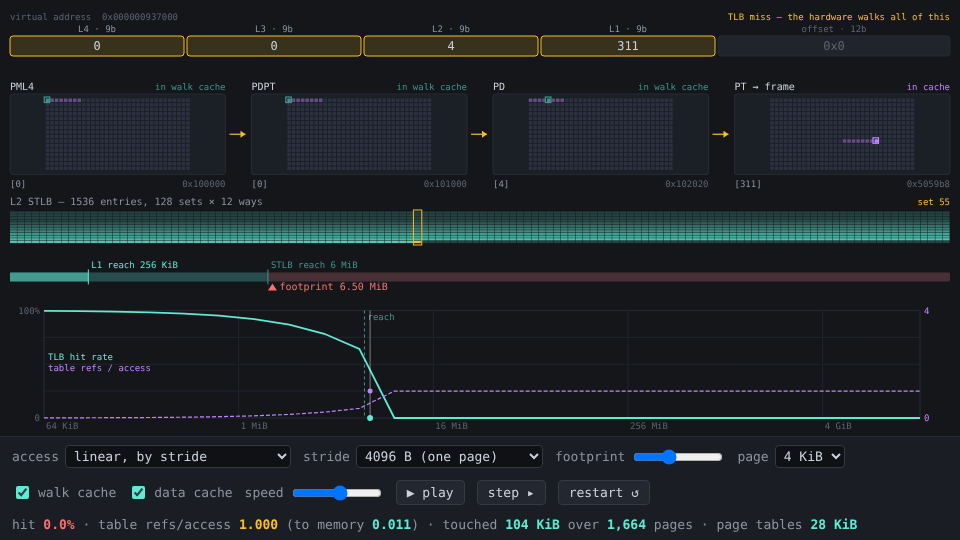
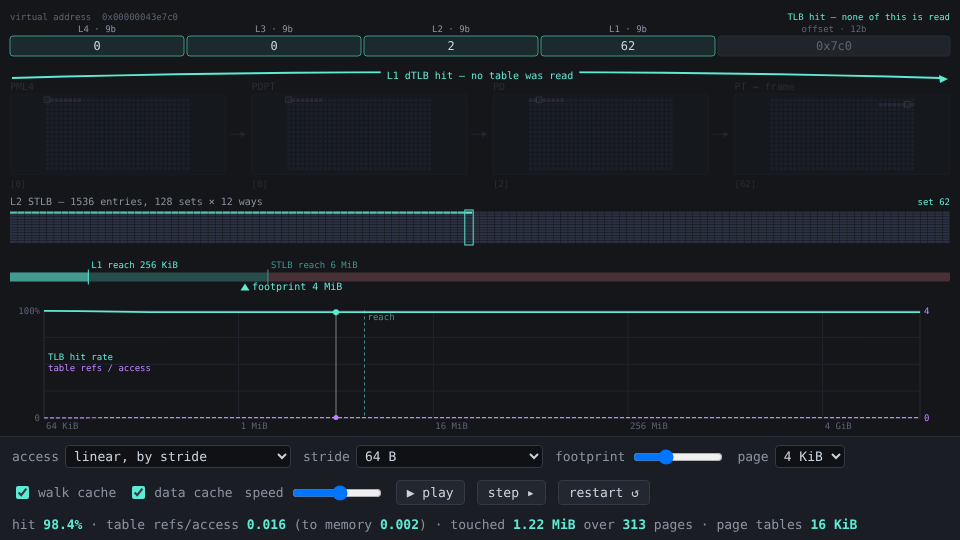
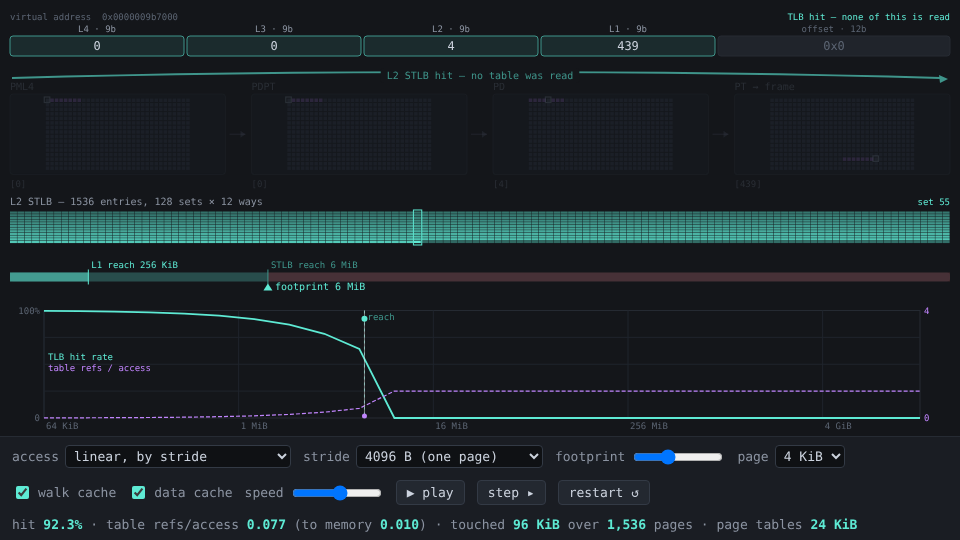
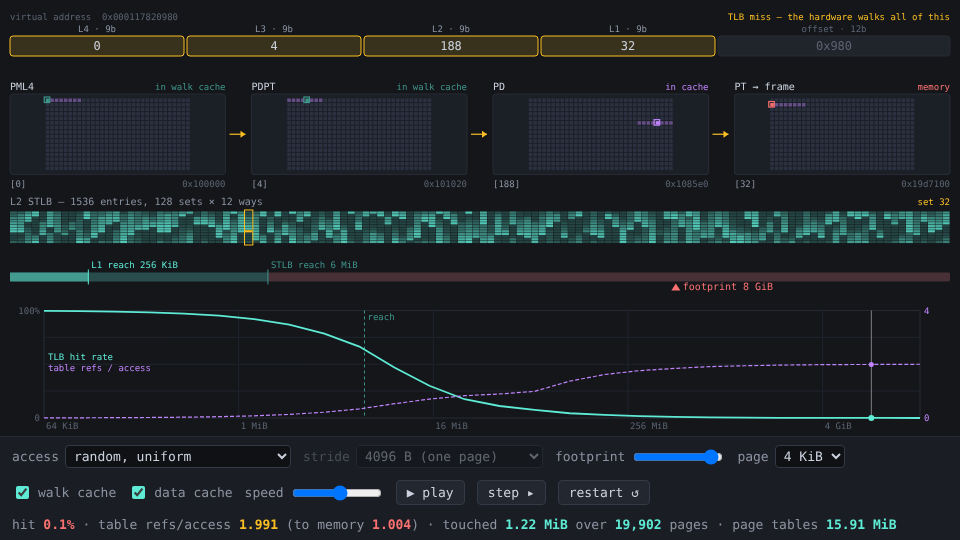
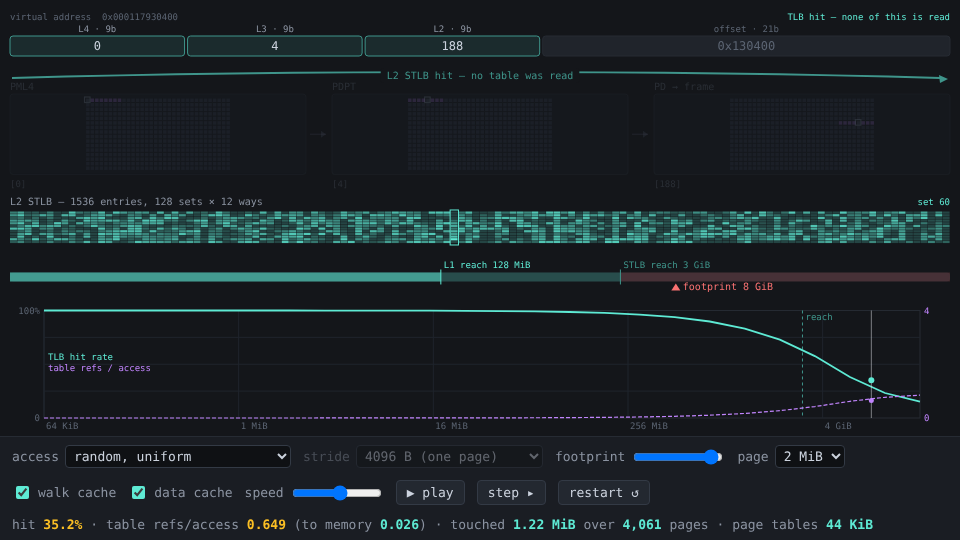
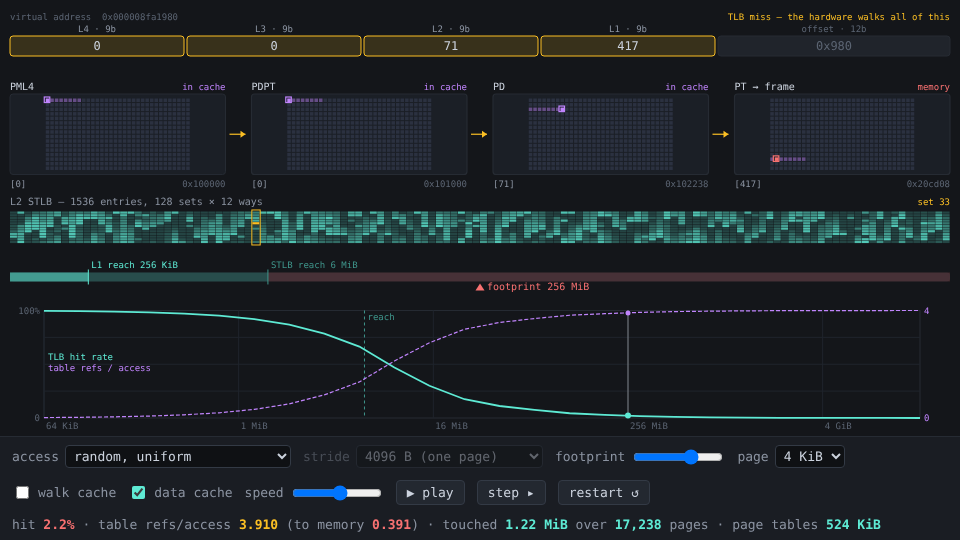
This draws the whole of it — the address split into its fields, the four tables as the 512-slot grids they are, the entry each index selects ringed inside its grid, and the 64-byte line it shares with seven neighbours lit in purple beside it. On a TLB hit every one of those plates greys out and a single arc flies over the top of them. That contrast is the piece.
Underneath, two things are counted rather than claimed: the hit rate, and the number of page-table references each access actually issues.
The cliff is 512 KiB wide, and it is associativity
The L2 STLB holds 1536 entries, so at 4 KiB pages it reaches 6 MiB — and
the obvious prediction is that a walk over more than 6 MiB starts missing.
Set the pattern to linear and the stride to one page, which touches every
page in the footprint and nothing else, and drag the footprint across it:
| footprint | pages | hit rate | table refs / access | data touched |
|---|---|---|---|---|
| 6144 KiB | 1536 | 92.32% | 0.077 | 96 KiB |
| 6400 KiB | 1600 | 44.16% | 0.559 | 100 KiB |
| 6652 KiB | 1663 | 0.66% | 0.994 | 103.94 KiB |
| 6656 KiB | 1664 | 0.00% | 1.000 | 104 KiB |
92.32% is not a good score the filter is about to lose. It is the ceiling:
1536 pages over 20,000 accesses is 1536 compulsory misses and not one other,
so 1 − 1536/20000 is 92.32% exactly, and the hardware is otherwise
perfect. Then 512 KiB of extra footprint takes it to a clean zero.
The width of that window is the part worth stopping on. Capacity ran out at the start of it — 1537 pages is already more than 1536 entries — and yet the filter is still at 94%. What finishes it is that the STLB is 128 sets of 12 ways, consecutive pages land in consecutive sets, and a set only breaks when it is asked to hold a thirteenth page. Every set has thirteen at
128 sets × 13 = 1664 pages = 6656 KiBand that is where the number goes to zero, to the page. The collapse is not a capacity curve; it is 128 identical sets failing one after another over a 128-page run, and the last one fails at exactly 13.
The stream that misses every time is the one touching the least data
Same 8 MiB region, same 20,000 accesses, and the only thing that changes is how far apart they are:
| stride | hit rate | table refs / access | data touched | pages |
|---|---|---|---|---|
| 8 B | 99.80% | 0.002 | 156.25 KiB | 40 |
| 64 B | 98.43% | 0.016 | 1.22 MiB | 313 |
| 512 B | 87.50% | 0.125 | 1 MiB | 2048 |
| 1024 B | 75.00% | 0.250 | 512 KiB | 2048 |
| 2048 B | 50.00% | 0.500 | 256 KiB | 2048 |
| 4096 B | 0.00% | 1.000 | 128 KiB | 2048 |
| 4160 B | 0.00% | 1.000 | 126 KiB | 2016 |
Read the two end columns together. As the stride grows the hit rate falls
87.50 → 75.00 → 50.00 — which is just 1 − stride/4096, the fraction of
accesses that are the first into a new page — and the amount of data the
program is actually touching falls with it, halving every row. At the
bottom the run is reading 128 KiB and missing the TLB on every single access,
while the 64 B scan above it reads ten times as much and hits 98.43%.
Nothing about the working set predicts this. 128 KiB fits in L2 cache with room to spare; it is 2048 pages that does not fit, and pages are the unit nobody sizes for. The classic way to arrive here is a column scan of a row-major array, or an array of structs where the hot field is one of many — the stride is the row, and the row happens to be a page.
Stride 4160 is the same thing one cache line off a page boundary, and it is worth a look because it behaves identically. There is no alignment trick hiding here: the cost is the page count, and 4160 touches just as many.
A sequential scan does not have a reach problem
Keep the stride at 64 bytes and move the footprint instead:
| footprint | hit rate | table refs / access |
|---|---|---|
| 4 MiB | 98.43% | 0.016 |
| 256 MiB | 98.43% | 0.016 |
| 8 GiB | 98.43% | 0.016 |
Three identical numbers across three orders of magnitude, because a scan uses each page sixty-four times before it moves on and then never comes back. The 64-entry L1 dTLB is enough. Reach is a property of the reuse distance, not of the heap — which is why “my data set is bigger than the TLB covers” is not by itself a diagnosis, and why the flat line in the curve panel is as informative as the cliff.
Switch the pattern to random, uniform and the same curve falls off the table
at 6 MiB, because now every access is a fresh page. Above reach its hit rate is
just reach / footprint. Switch to skewed and at 8 GiB it reads 57.78%
against uniform’s 0.08% on the identical footprint: real workloads survive
because they are skewed, and they stop surviving the moment a hash lookup
makes them uniform.
What a 4 KiB page costs at 8 GiB
Random access over 8 GiB, changing only the page size:
| page | hit rate | table refs / access | of those, to memory | reach | page tables |
|---|---|---|---|---|---|
| 4 KiB | 0.08% | 1.991 | 1.004 | 6 MiB | 15.91 MiB |
| 2 MiB | 35.17% | 0.649 | 0.026 | 3 GiB | 44 KiB |
| 1 GiB | 99.95% | 0.001 | 0.000 | 1536 GiB | 8 KiB |
The middle column of the first row is the one to keep. 1.004 references to memory per access, before the access itself — the program has doubled its memory traffic and every byte of the extra half is page tables. Huge pages fix it twice over, by making the walk shorter (a 2 MiB page stops at the third level, a 1 GiB page at the second) and by multiplying reach by 512 per step.
The last column is the quieter cost. Those 20,000 random touches landed in 19,902 distinct pages and dragged in 15.91 MiB of page tables to describe them, because a leaf table is 4 KiB and sparse touches almost never share one. At 2 MiB pages the same 8 GiB needs 44 KiB. Page tables are data, they compete for the same cache, and at 4 KiB granularity there can be more of them than there is cache.
Five is wrong, and two things make it wrong
“A TLB miss costs five memory references” is the number everyone quotes and it is an upper bound nobody actually pays. Random over 256 MiB, toggling the two boxes:
| table refs / access | of those, to memory | |
|---|---|---|
| both on | 1.710 | 0.391 |
| walk cache off | 3.910 | 0.391 |
| data cache off | 1.710 | 1.710 |
| both off | 3.910 | 3.910 |
The walk cache is worth 2.200 references per access, flat. Intel’s paging-structure caches remember the top of the path, and the top of the path is enormously shared — one PML4 entry covers 512 GiB and one PDPT entry covers 1 GiB, so inside a 256 MiB region the first two levels are the same two entries on every access and the walk starts at the third. A walk here reads 1.749 tables, not four: two levels every time, and the third as well on the 26% of walks whose PD entry is still cached. Shrink the region to 6.5 MiB and that goes to 1.002 — the walk cache answers all three upper levels and the only read left is the leaf, which is what the plate labels in the thumbnail say.
The data cache takes 1.710 down to 0.391. Page-table entries are ordinary memory in ordinary cache lines, and eight of them share a line — so touching one page pulls in the entries for seven neighbours, which is why the purple siblings are drawn beside the ringed entry.
So the honest number at 256 MiB is 0.391 trips to memory, not five, and the whole gap is those two mechanisms. Turn both off and it is 3.910 — which is what the folklore is actually describing, and it is describing a machine that has not existed for a long time. The folklore is still right about the shape: turn the footprint up to 8 GiB with both on and it climbs back to 1.004, because at that size nothing is shared and nothing stays cached.
Reading it
Space plays, → steps one access, r restarts. The plates grey out when the
TLB answered, which at a hit rate of 98% is most frames — hold → through a
run near the cliff and the greyed frames stop coming.
The STLB strip under the plates is the array itself: 128 columns of 12 ways, brightest where most recently used, with the current access’s set outlined. At 1536 pages it sits still. At 1664 every column is churning and you can watch the thirteenth page evict the one that is about to be needed.
The curve at the bottom is the same stream swept across footprints, measured one point per frame rather than plotted from a formula; teal is hit rate, the purple dashes are table references per access, the dashed vertical is reach. Changing the page size moves that vertical and the curve under it together.
Reuse
src/reach.js is a framework-free ES module:
SetAssoc(entries, ways)— true-LRU set-associative cache. Both TLBs, the paging-structure caches and the data cache are this, with different numbers.access,has(no LRU update, for drawing),snapshot.PageTables({ pageSize })— real radix tables over a real physical frame space, built on first touch.map(va)returns the frame and the per-level steps, each carrying the physical address of the entry read.MMU({ pageSize, l1, l2, pwc, cache, pwcOn, cacheOn })—access(va)returns one event: which level answered, every step with where it was fetched from (pwc/cache/mem), andrefs/dram.addresses({ pattern, footprint, stride, pageBytes, seed })— the three streams, as a generator function.simulate,sweepFootprint,sweepStride— runs and ladders.simulatekeeps one event per access up tokeep, so a renderer can replay.PAGE_SIZES,PATTERNS,LEVELS,DEFAULT_MMU— the vocabulary, so the demo’s selects are generated rather than transcribed.
No rendering and no timers in the module; the canvas demo is reference code.
Gotchas
- The TLBs are true LRU, and real ones are not. That is what makes the 0.00% exact: a cyclic scan is LRU’s worst case, and nothing survives it. Real hardware uses a pseudo-LRU or a randomised policy precisely to avoid this, and would show a few percent here instead of zero. The position of the collapse is right; its floor is LRU’s signature, not silicon’s.
- The data cache is 512 KiB, standing in for an L2. A real LLC is tens of
MiB and would absorb more page-table lines than this does, so
to memoryis pessimistic at large footprints and the 0.391 at 256 MiB is the number to trust more than the 1.004 at 8 GiB. - No TLB prefetcher, no page-walk parallelism, no 2 MiB-vs-4 KiB TLB split. Real cores walk several misses at once and keep separate TLB arrays per page size. All of that moves latency; none of it moves the hit rate, which is what every claim here is made of.
- Counts, not cycles. Nothing in here is a time. A miss is drawn as the references it issues, because that is the part that is architectural — the cycle cost of those references belongs to a memory system this does not model.
- The first touch of a page allocates its tables silently. The page-fault
path is modelled only as far as “the mapping now exists”, so
page tablesgrows during a run and nothing is ever unmapped. - The demo bundles its own copy of
reach.js(self-contained by contract); re-copy after editingsrc/. node scripts/screenshot-demo.mjs [out] [--pattern=] [--stride=] [--page=] [--footprint=6656K] [--no-pwc] [--no-cache] [--at=] [--sweep] [--w= --h=]regeneratesthumb.pngthroughsite/scripts/lib/chromium.mjs.--footprinttakes a K/M/G suffix and is set exactly, bypassing the slider’s quantisation, which is the only way to land on 1664 pages.