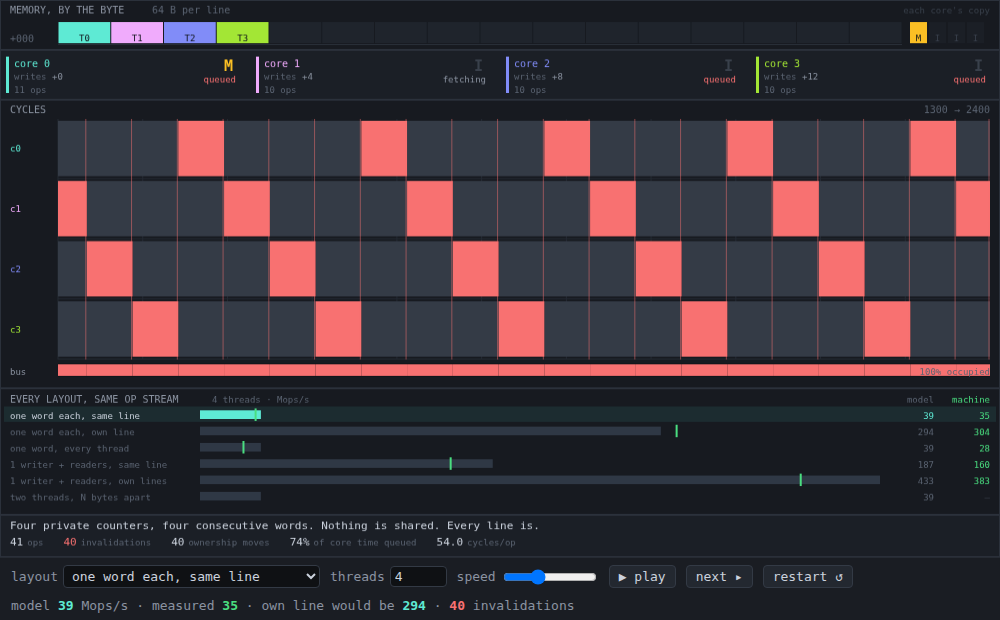
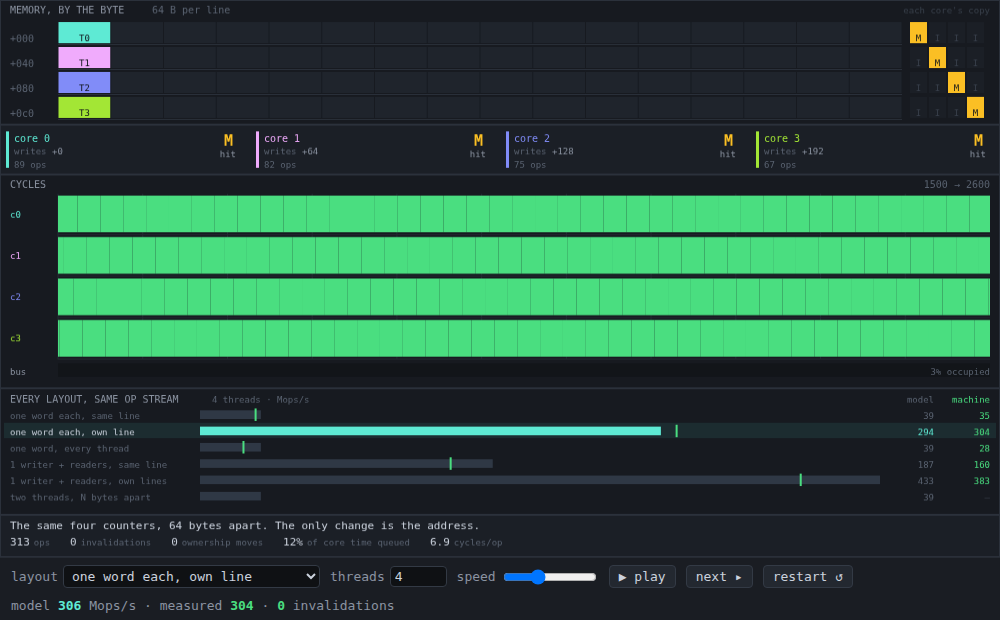
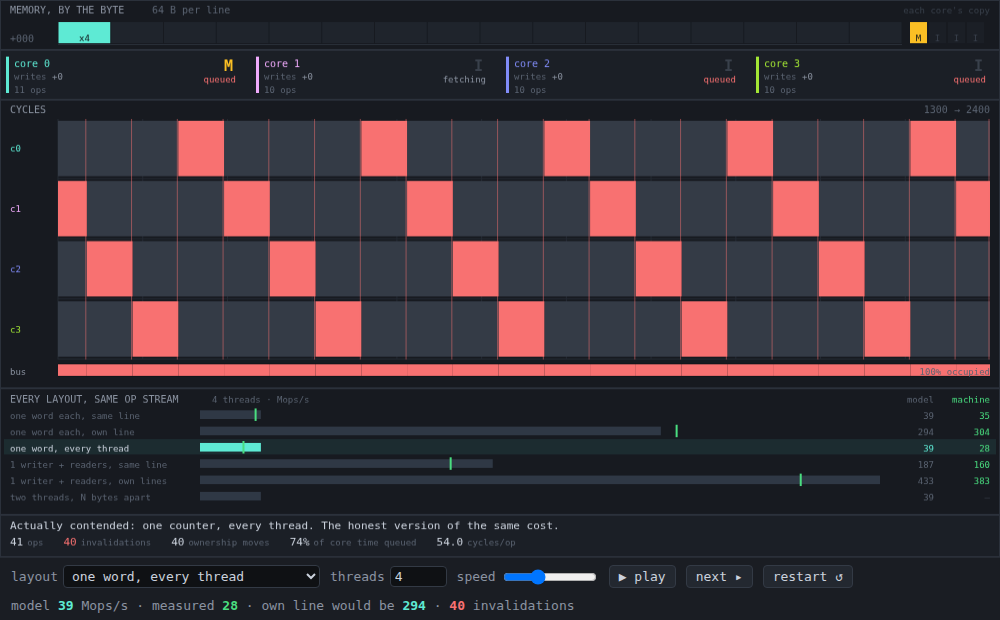
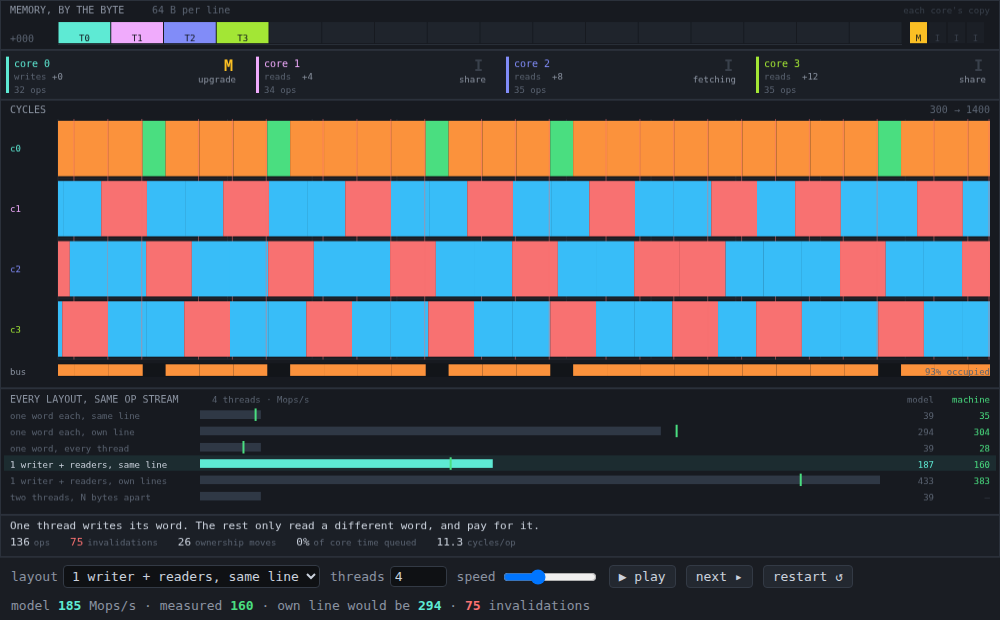
The usual drawing of a parallel loop is a row of boxes with a thread in each, and an arrow underneath labelled shared state pointing at the one variable they all touch. Everything in it is correct. What it cannot show is the case where there is no arrow — four threads, four separate counters, nothing shared, no lock, no atomic contention in the logical sense at all — and the loop still runs at a tenth of its speed.
The unit nobody declared is the cache line. A core does not own a byte or a variable; it owns 64 bytes, and it owns them exclusively while it writes. Four counters declared next to each other are one allocation to the programmer and one line to the hardware, and the hardware is the one that arbitrates.
So this is a measurement with a simulator attached, rather than an animation.
scripts/measure.mjs runs the experiment on the machine, and
src/same-line.mjs is a MESI model small enough to argue with, calibrated on
three of those measurements and then graded against the rest.
What the machine did
Four threads, one SharedArrayBuffer, four million atomic read-modify-writes
each, median of 5 interleaved trials on a 4-core Xeon at 2.1 GHz. Every op is
an Atomics.add, which matters: a locked RMW cannot be hoisted into a
register, elided, or reordered away, so the op count in the loop is the op
count that reached the cache. The only variable between these three rows is
which byte each thread’s counter sits on.
| layout | Mops/s | relative |
|---|---|---|
| one word, every thread (genuinely contended) | 27.70 | 0.78x |
| one word each, one line (shares nothing) | 35.43 | 1.00x |
| one word each, own line | 303.70 | 8.57x |
Read the first two rows together, because they are the whole point.
Four threads that share no data at all ran within 1.28x of four threads hammering a single counter. One of those programs has every thread fighting over the same word and is supposed to be slow. The other has four private variables, no contention, nothing to serialise — and it buys back 28% for it. False sharing is not a diminished version of true sharing. It is very nearly the same bill, for none of the reason.
Adding cores made it slower than one core
| threads | one word | same line | own line | speedup, same | speedup, own |
|---|---|---|---|---|---|
| 1 | 86.42 | 76.83 | 76.66 | 1.00x | 1.00x |
| 2 | 32.98 | 40.51 | 144.62 | 0.53x | 1.89x |
| 3 | 29.69 | 37.48 | 227.69 | 0.49x | 2.97x |
| 4 | 27.70 | 35.43 | 303.70 | 0.46x | 3.96x |
On its own line a thread is worth 3.96x by four threads — near-linear, which is what the workload deserves, since there is genuinely nothing shared in it.
On a shared line the same workload is worth 0.46x. Not sublinear: negative. Four cores finish less than half the work one core would have, and the second core is already the one that did the damage — 0.53x at two threads, and the line is flat from there. Every core after the first is paying to take a line away from the core that just took it, and nobody holds it long enough to use it. This is the row to remember, because it inverts the instinct the whole exercise started from: the parallel version is not merely failing to scale, it is a pessimisation of the serial one.
The thread that wrote nothing
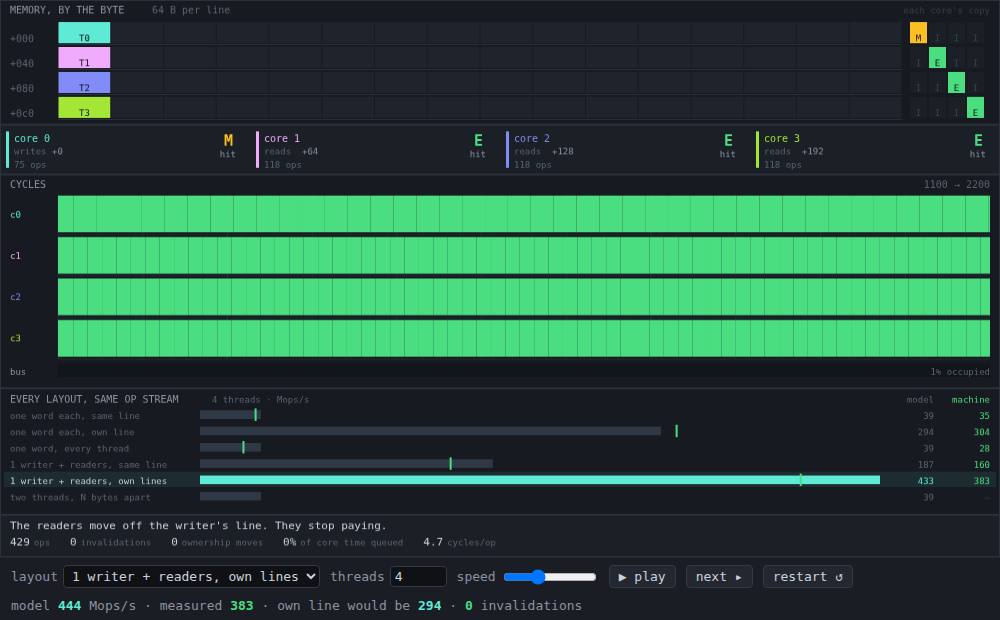
One thread writes its own word. The other three only ever read a different word — they never write anything, they contend for nothing, and by any reading of the source they are not participating.
| readers | Mops/s |
|---|---|
| readers share the writer’s line | 159.72 |
| readers on their own lines | 382.77 |
2.40x, taken from threads that are not writing. A reader’s copy is valid until somebody else’s write invalidates it, and the writer invalidates the whole line, not the word it changed. So the cost lands on code that is read-only, correct, and innocent — which is why this one is so hard to find by reading a diff. The expensive line is not in the function that got slow.
The cliff is four bytes wide
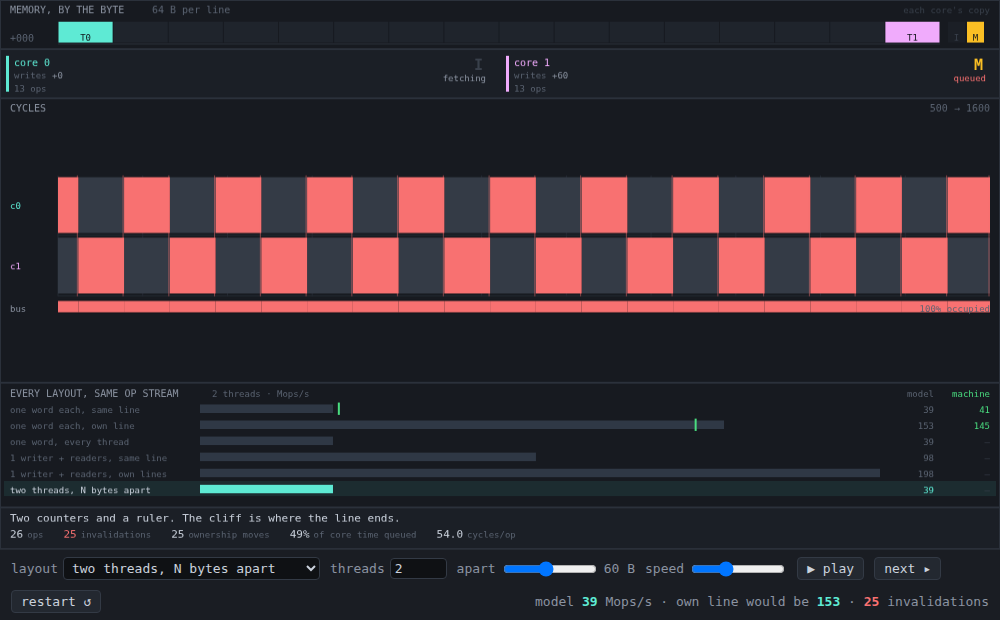
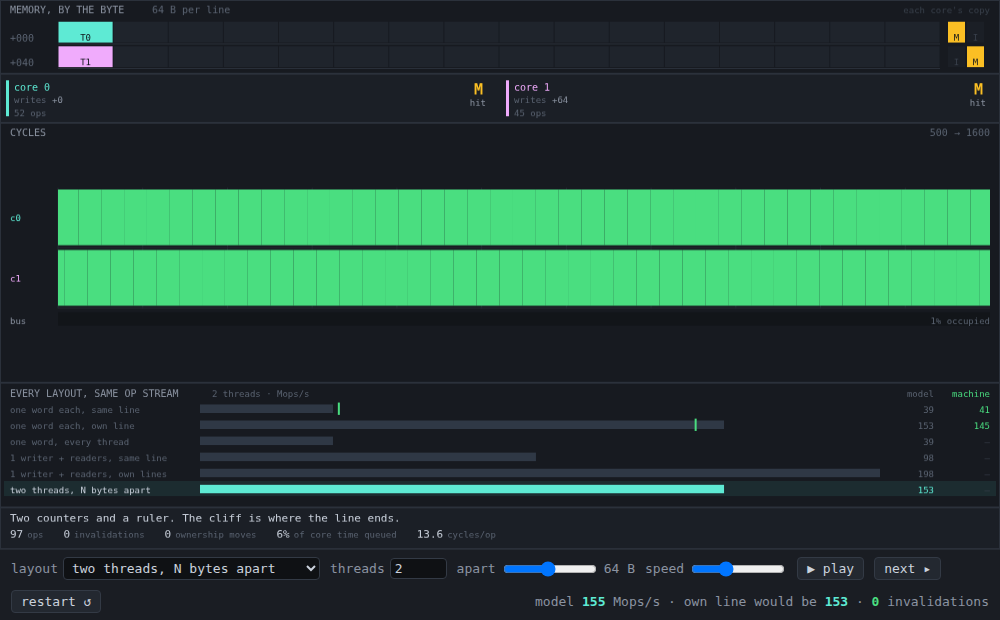
Two threads, one counter each, walking apart a word at a time:
| apart | 56 B | 60 B | 64 B | 68 B | 80 B |
|---|---|---|---|---|---|
| Mops/s | 41.2 | 40.4 | 167.5 | 151.7 | 164.5 |
Flat at ~39 for every offset below 64, flat at ~160 for every offset at or above it. The step is 4.02x between the medians either side of the boundary, and 4.15x between the two adjacent measurements, for moving one counter four bytes. There is no gradient to tune along and no profile that will point at it, because nothing in the program changed: same instructions, same op count, same threads. The only thing that moved was an address, across a boundary the source language does not have a word for.
And nothing here was told where that boundary is. JS cannot ask a
SharedArrayBuffer what address it has, and V8’s backing store is not
line-aligned, so the script measures the boundary before it uses it: step 0
sweeps two threads apart and reads the alignment off the step. In three
separate full runs it found the arena sitting 16 B, 32 B, and 48 B into a line
— a different answer every time — placed its base accordingly, and the
confirming sweep then cliffed at exactly 64 B in all three. The hardware
will tell you where its boundaries are, if the only thing you ask it for is
time.
The model, and where it is wrong
src/same-line.mjs is MESI with one serialising coherence point and six
latencies. Three are calibrated, each from the one measurement that isolates
it: localRmw 27 cycles (one thread, alone), transfer 54 (two threads, one
line), localRead 17 (readers on their own lines). shareFill 45 and
upgrade 40 are ordinary same-socket L3 latencies, left where the hardware
puts them. Everything else below is a prediction.
| model | machine | error | |
|---|---|---|---|
| 4 threads, own line | 305.7 | 303.70 | 0.6% |
| 3 threads, own line | 230.9 | 227.69 | 1.4% |
| 2 threads, own line | 154.8 | 144.62 | 7.0% |
| 3 threads, same line | 38.9 | 37.48 | 3.7% |
| 4 threads, same line | 38.9 | 35.43 | 9.7% |
| readers on their own lines | 367.0 | 382.77 | 4.1% |
| readers on the writer’s line | 131.0 | 159.72 | 18.0% |
| reader penalty | 2.80x | 2.40x | 16.9% |
Near-linear scaling off its own line, a flat shared line, a 64 B cliff and a reader penalty of the right size all fall out of one assumption: a line can be in one core’s Modified state at a time, and the transition is serialised. Nothing in the model knows about threads, loops, or false sharing as a concept.
The one place it is knowingly wrong is the first table. The model says four threads on one line and four threads on one word cost exactly the same — identical invalidation counts, identical throughput, 0.0% apart. The machine says the genuinely contended case is 1.28x worse. That gap is real and the model has no term for it: when the word is shared the atomic RMWs serialise on the value as well as the line, so the read-modify-write critical sections queue behind each other on top of the line moving. The model only moves lines. It is recorded here as a miss rather than tuned away, because the shape of the miss is the physics the model left out.
The other soft spot is the reader row, at 18%. A real interconnect pipelines concurrent shared fills far better than one bus does, so the model over-charges readers; the asymmetry that reads do not serialise is in there (and without it the model was out by 20x), but it is still a bus.
What’s on screen
- The ruler is memory by the byte: one row per 64-byte line, sixteen 4-byte
cells each, with every thread’s counter drawn where it actually sits. Whether
two filled cells land in the same row is the experiment. On the right, each
core’s copy of that line, as a MESI letter — in the shared layout you will
almost never catch a core holding anything but
I. - The lanes are one per core, time in cycles left to right, every op drawn as the window it occupied. Pale grey is the core queued at the coherence point doing nothing; solid colour is work. Green never touched the bus, red is ownership being dragged out of another core’s cache, orange is a write invalidating the other sharers, blue is a read fill. A vertical red line is the moment one core’s write took everybody else’s copy away.
- The bus is the row underneath, and it is the answer to why the lanes are pale. Same line: 100% occupied, 999 ownership moves per 1000 ops, zero local hits, 75% of all core time spent queueing. Own line: 996 of 1000 ops are local hits, the only bus traffic is the four cold misses, and that is a constant however long you run it.
- The scoreboard carries every layout on the same op stream at all times, with the machine’s own number as a green rule on each bar, so the comparison never requires remembering a previous run.
- The slider under the
two threads, N bytes apartlayout is the cliff, by hand. Drag from 60 to 64.
Notes
src/same-line.mjsis framework-free with no rendering in it.simulate()keeps every op as a drawable event — including when the core wanted to issue versus when the coherence point let it, which is the gap the pale bars draw.layoutSweep,threadSweep,readerSweepandoffsetSweepproduce every model table above.scripts/screenshot-demo.mjschecks 39 claims against the running model on every build, including the structural ones that rot silently: that a padded run has exactly zero invalidations at 1, 2, 4 and 8 threads; that a shared run records zero local hits and a bus transaction for every single op; that false sharing and true sharing invalidate identically; and each model-vs-machine error above, against its stated tolerance.- Two full runs of
measure.mjsdisagree by more than you might like, and both are quoted here on purpose. The headline ratio was 8.57x in the run the demo carries and 7.28x in the next one; own-line throughput at 4 threads varied 30.8% and 57.4% rep-to-rep within a single run. This is a shared cloud vCPU and the fast conditions are the noisy ones. What replicates exactly is the part that matters: the 64 B cliff (three runs, three alignments), the reader penalty (2.40x, 2.42x), false sharing landing within ~1.27x of true sharing, and same-line scaling below 0.5x. Conditions are measured interleaved within each rep and reduced by median, because an earlier version measured them in separate passes and got 212 and 279 Mops/s for the same configuration. - The non-atomic control is in the script because it does not work. The same
four layouts with plain
i32[k] = i32[k] + 1increments came out at 0.92x and 1.21x in the two runs — no effect, in one case backwards. JS permits an engine to keep a racing non-atomic access in a register, so that row measures TurboFan more than the memory system. It is kept as a warning: in a language that allows the optimiser to delete your stores, a microbenchmark of a memory effect that does not pin its ops down is measuring nothing, and will look reassuring while doing it. - An “op” throughout — in the model’s constants as much as the measurements — is
one iteration of the measured loop, bounds check and all, not a bare machine
instruction. That is what lets the constants be calibrated rather than
invented, and it is why
localRmwis 27 cycles and not the 4 a cache-latency table would quote. - 64 bytes is assumed and not measured as a constant, though the cliff confirms it on this machine. Apple silicon uses 128-byte lines, and the same code would find the same cliff twice as far out.