A profile of a thumbnail service — 2,400 uploads, 2,568 ms of CPU, fourteen frames — drawn as an ordinary flame graph. Every frame is clickable. Clicking one rewrites it in the fast language: its self time divides by the speedup, the frame narrows, the graph reflows.
That much is a toy. The piece is the second thing every click does. A rewritten
frame whose caller is still native has a boundary at its edge, and the
boundary is drawn as a pink seam in the same horizontal units as the work —
milliseconds of wall clock, taking space away from everything else on the row.
Its width is calls × crossing cost, and the call count is the one number a
flame graph never shows you. So the economics invert depending on where you
click:
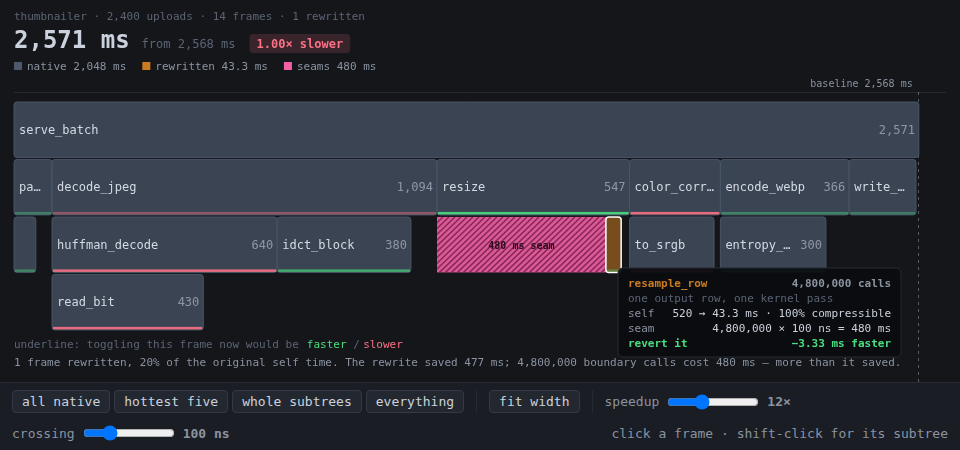
entropy_encode— 300 ms of self time, entered 2,400 times. Rewrite it and it collapses to a sliver with a seam too thin to see. 275 ms off the batch for one click.resample_row— 520 ms of self time, entered 4.8 million times. Rewrite it and it is genuinely, measurably twelve times faster on the inside; its seam is 480 ms wide; the batch gets 3 ms slower. A rewrite that is correct, faster where you measured, and worth exactly nothing.to_srgb— 240 ms, entered 9.6 million times. 220 ms saved, 960 ms of seam. The single worst thing you can do to this program is make its hottest leaf twelve times faster.
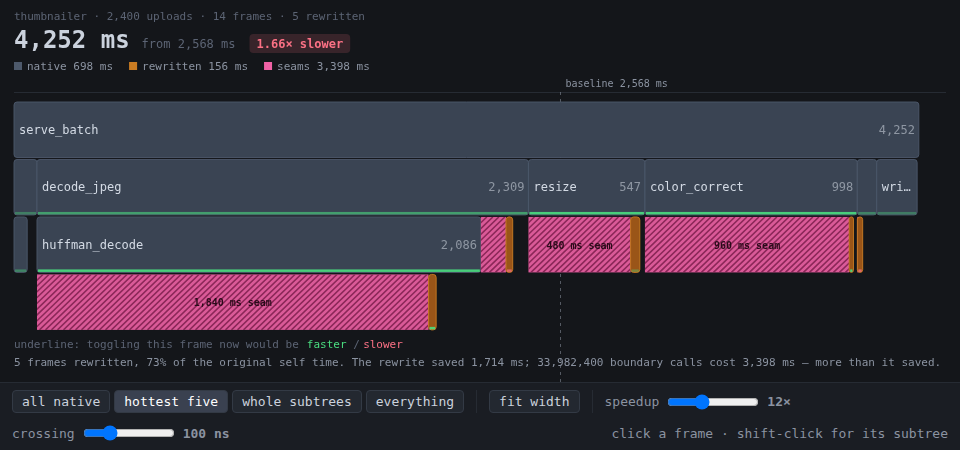
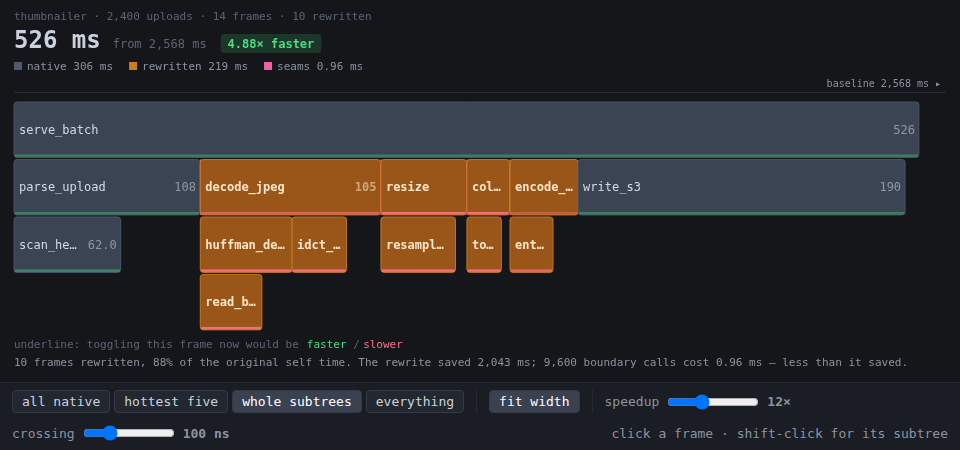
The hottest five preset is the whole argument in one button. It rewrites the five frames with the most self time — 73% of the profile, every one of them a real speedup, exactly what a flame graph read top-down tells you to do — and the batch takes 1.66× longer than it did in Python. Whole subtrees rewrites the same hot work together with the frames that call it, so the boundaries land on 2,400-call edges instead of 33-million-call ones: 4.88× faster, and the seam total falls from 3,398 ms to 0.96 ms.
Everything is drawn to one scale, so the graph shrinks or overruns against the
dashed baseline marker at 2,568 ms. fit width rescales to the current
total when a big win has squeezed the frames too thin to read.
Things worth trying
- Drag crossing to 0 and the seams vanish: at a free boundary not one frame in the profile is a bad rewrite, and “hottest five” turns into a 3.01× win. Every wrong answer in this piece is a per-call cost the picture didn’t show.
- Drag crossing up to 400 ns — roughly
ctypesrather than PyO3 — and the only frames still worth rewriting on their own are the five entered 2,400 times. The frontier is never “how hot is it”, it is “how hot per call”. - Rewrite
read_bitalone (the deepest frame, 18.4 million calls, +1,446 ms), then shift-clickhuffman_decodeto take its subtree. The same leaf that cost 1.4 seconds becomes free the moment its caller stops being on the other side of a boundary. write_s3is 190 ms of self time and only 5% compressible — it is waiting on a socket, not computing. It is the fourth-hottest frame in the profile and rewriting it buys 8 ms. Self time never said what kind of time.- Turn speedup down to 2× and most of the wins evaporate while every seam stays exactly where it was. Seam cost does not scale with how good your rewrite is.
The underline under each frame is the marginal answer: what toggling that frame would do to the total, given everything else as it stands right now. Green means faster, red means slower, and the interesting thing is that it changes as you work — converting a caller flips its children from red to green, which is the entire “convert contiguous districts” strategy showing up as a colour change.
Reuse
src/seam.js is a framework-free ES module: no timers, no DOM, no rendering.
PROFILE/frames()— the tree, and a flat DFS list with ids, depths, call counts andbound(the fraction of a frame’s self time that is CPU work a rewrite can actually compress;write_s3is 0.05).evaluate({ converted, speedup, crossingNs })— costs the whole tree and returns every node with itsself,seam,totalandslot, plus totals for native work, rewritten work and seams. Pure; call it as often as you like.marginalDeltas(state)— for every frame, what toggling it would do to the total from here. Fourteen evaluations of a fourteen-node tree, so the demo just recomputes it on every change.layout(result, { scale, rowH })— rectangles. Children fill from the left, a frame’s own self time is the remainder at its right, and a seam occupies the leadingseam × scaleof its child’s slot.PRESETS,subtreeIds(id),BASELINE.
Swap RAW in the module for a real profile — name, calls, self ms, and a
bound per frame — and the whole piece re-costs itself.
Gotchas
- The cost model charges one crossing per call on an edge where the two
languages differ, in both directions folded into one number. Real boundaries
are messier: argument marshalling scales with payload size, PyO3 releases the
GIL and Node’s N-API does not, and a rewritten frame usually stops allocating
in the host heap, which is a win the model never gives it. The default 100 ns
is a plausible PyO3 call;
ctypesis closer to 1 µs and a JNI call is its own world. - Converting a frame in the middle of a chain stitches two seams, not one —
above it and below it. That is why rewriting
huffman_decodeon its own (+1,648 ms) is worse than rewritingread_biton its own (+1,446 ms), even thoughhuffman_decodeis entered 2,400 times. - The layout animates in milliseconds and is scaled to pixels at paint time, so the frames and the baseline marker always agree while the graph is reflowing. Smoothing pixel widths directly makes the marker drift out from under the bars mid-transition.
- Frames narrower than about 1.5 px are still hoverable but hard to hit. That
is what
fit widthis for. - The demo bundles its own copy of
seam.js(self-contained by contract); re-copy after editingsrc/.