Every store you can actually buy is one-dimensional. A B-tree, an LSM, a key-value API, a file: each of them hands you intervals — start here, read forward. A map is two-dimensional, and so is every interesting question you ask it: everything inside this rectangle. Somewhere between those two facts you have to choose an order, and the order is the whole performance story, because a rectangle has to be broken into intervals before the store will accept it.
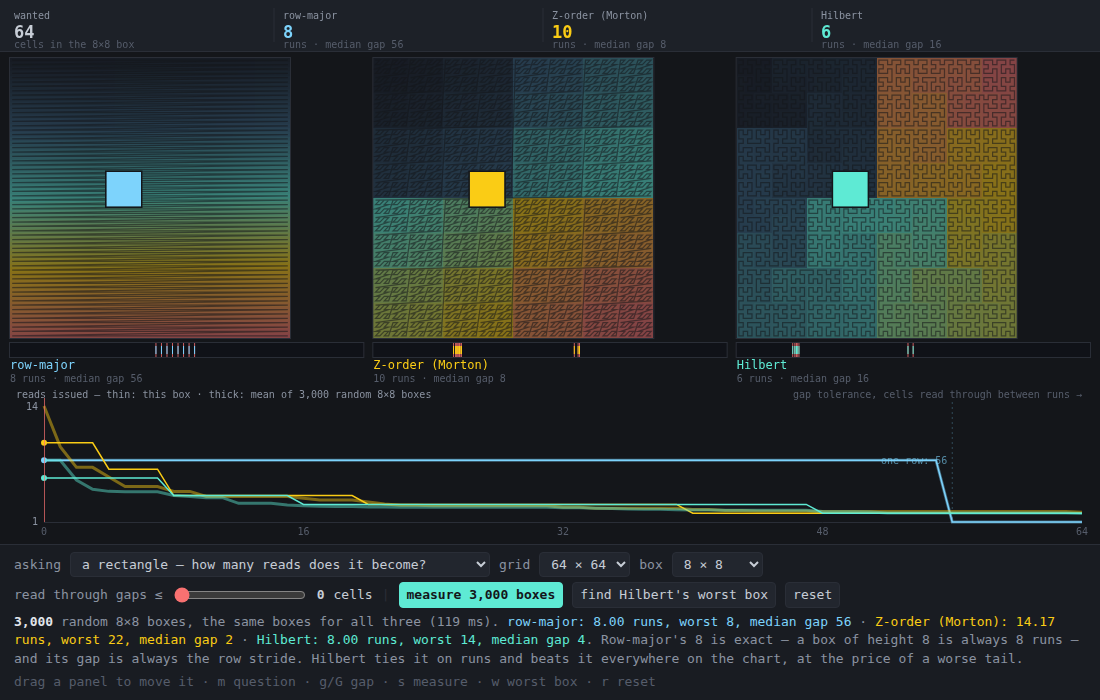
Three panels, one grid, one box. Each panel colours every cell by where it sits along that layout’s curve — cool early, warm late — so two cells that look alike are close together in the store. Underneath each panel is the store itself, drawn as one line, with the box’s cells marked on it. Drag the box anywhere; all three panels are always answering for the same rectangle.
The tie nobody expects
The obvious metric is the number of runs: how many separate seeks does this rectangle become? Over 3,000 random 8×8 boxes on a 64×64 grid:
| layout | mean runs | worst box | median gap between runs |
|---|---|---|---|
| row-major | 8.00 | 8 | 56 |
| Z-order (Morton) | 14.17 | 22 | 2 |
| Hilbert | 8.00 | 14 | 4 |
Read that again, because it is the opposite of the folklore. Hilbert — the curve people reach for precisely because of its locality — ties the naive layout, and Z-order, the one that actually ships inside geohashes and S2 and half the spatial indexes in the world, is nearly twice as bad. Row-major’s 8.00 is not an average at all: a box of height h is exactly h runs, always, one per row. It cannot do better and it cannot do worse.
So if you count seeks, the fancy curve buys you nothing.
The metric that decides it
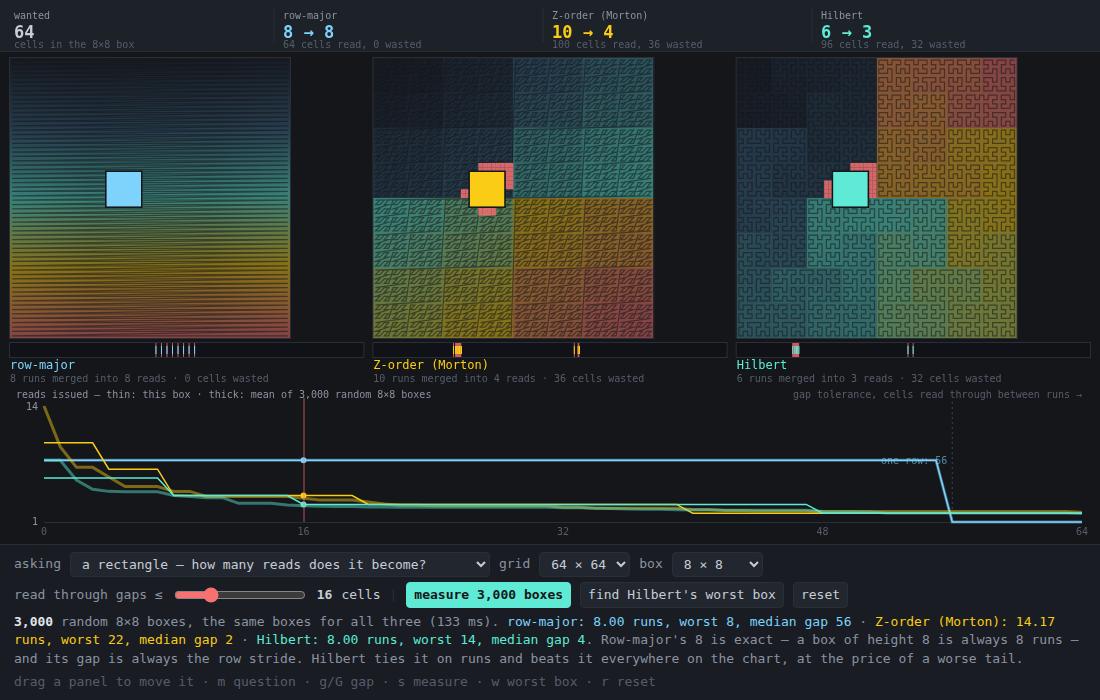
No real store seeks between two runs three cells apart. It reads straight through and throws the middle away, because one read of 67 cells costs less than two reads of 32. The slider at the bottom is that policy: read through gaps of g cells or fewer, and watch what each layout does with the permission.
| g | row-major | Z-order | Hilbert |
|---|---|---|---|
| 0 | 8.00 | 14.17 | 8.00 |
| 4 | 8.00 | 6.12 | 4.48 |
| 16 | 8.00 | 3.70 | 2.84 |
| 56 | 1.00 (+392 wasted cells) | 2.20 (+74) | 2.02 (+58) |
Row-major does not move. It cannot move: consecutive rows of the box are exactly one row stride apart — 56 cells for an 8-wide box on a 64-wide grid — so nothing merges until the tolerance can span an entire row of the map, and at that point the single read it finally issues drags in 392 cells nobody asked for, six unwanted for every one wanted. Z-order’s median gap is 2 and Hilbert’s is 4, so both of them are already collapsing at g = 4 while row-major sits at 8.
That is the real result, and the chart at the bottom of the demo is the whole argument in one picture: three curves of reads against tolerance, with the row-major line flat across the entire chart and then falling off a cliff at exactly one row stride. The count was a tie. The distances were not.
The same property from the other side
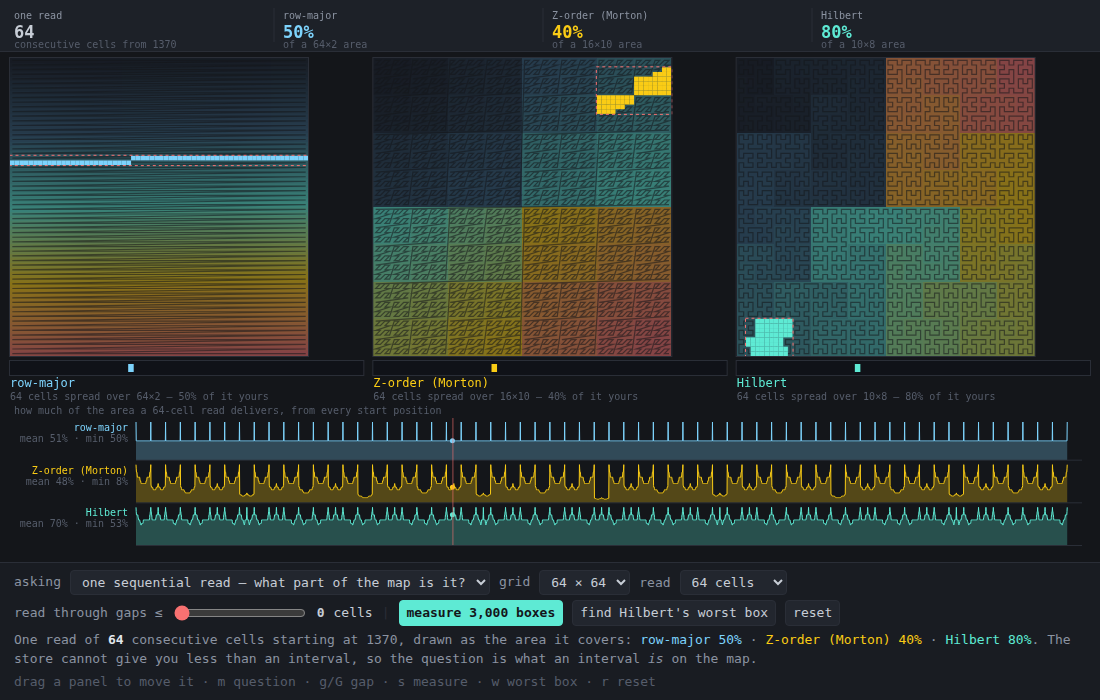
Switch the question to one sequential read — what part of the map is it? and the demo runs the argument backwards: take one interval of the store and draw the area it covers. Over every possible start of a 64-cell read:
| layout | mean of the touched area actually delivered | worst |
|---|---|---|
| row-major | 50.8% | 50.0% |
| Z-order | 47.6% | 8.3% |
| Hilbert | 69.9% | 53.3% |
A 64-cell row-major read is a 64×1 sliver — everything one cell above it is another seek. An aligned Hilbert read is an 8×8 block, and even a badly aligned one never falls below 53%. Z-order’s worst case is the honest smudge here: a read straddling the seam between two top-level quads sprawls over a 16×10 area and delivers 8% of it.
One caveat the piece does not hide: crank the read up to 256 cells and row-major’s mean fill (80.3%) beats Hilbert’s (69.6%), because 256 is four whole rows. Fill is not the same as usefulness — a 64×5 strip is a high-fill read of a shape almost no query wants. The area matters, but so does whether it is square.
What it costs Hilbert
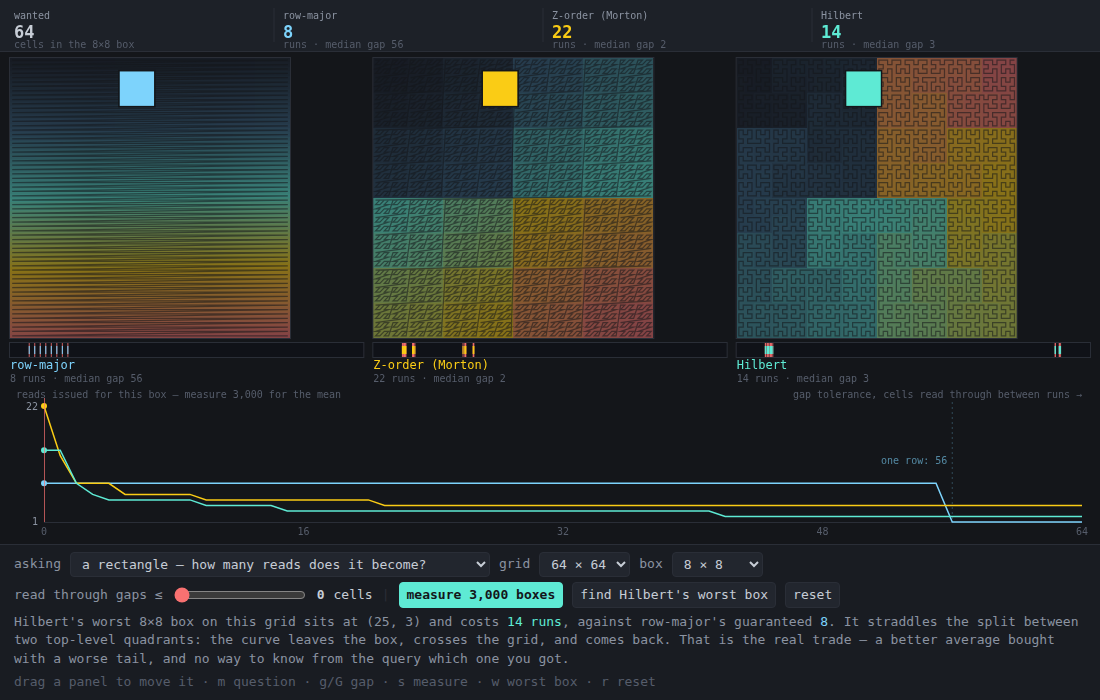
Press find Hilbert’s worst box. On a 64×64 grid the worst 8×8 box sits at (25, 3) and costs 14 runs, against row-major’s guaranteed 8. It straddles the split between two top-level quadrants: the curve leaves the box, crosses the map, and comes back. Hilbert’s average is the best of the three and its tail is worse than the layout that never varies — and nothing in the query tells you which one you drew. That trade is why “use a Hilbert curve” is a design decision and not a free win, and it is why Z-order ships more often despite losing on every locality number here: the Morton index is a bit interleave (a few instructions, invertible, and a prefix of the key is a quadtree cell), while a Hilbert index is a loop over the bits with a rotation at every level and no equally clean prefix story.
Reuse
src/curves.js is framework-free and DOM-free:
index(curve, x, y, n)/point(curve, d, n)— the three orders, both directions,curveone ofrow|z|hilbert.nmust be a power of two (up to 2¹⁵ per side; the Morton path is 32-bit bitwise).path(curve, n)— the whole curve as a flat[x0,y0,x1,y1,…], for drawing.boxRuns(curve, n, box)— a rectangle as maximal runs of consecutive indices.coalesce(runs, gap)— merge runs closer thangap; reports reads issued, cells fetched, cells wasted.gaps(runs)/readsVsGap(runs, maxGap)— the distance distribution, and the reads-against-tolerance curve the chart draws.runFootprint(curve, n, start, len)— the reverse direction: an interval as a 2D area, with its bounding box and fill.sweep(n, w, h, trials, opts)— all three layouts over the same random boxes (seeded, so the comparison is fair), returning means, worst cases, median gaps and mean reads-vs-tolerance curves.verify(n)— asserts each order is a bijection and that Hilbert’s consecutive indices are always adjacent cells. Worth keeping: a Hilbert implementation that is off by a rotation still looks plausible.
Gotchas
- The colour ramp is painted once into an n×n bitmap per (curve, n) and blitted;
the curve’s polyline is a cached
Path2Din grid coordinates, stroked under a scale transform. Drawing 4,096 cells three times a frame the naive way is where this kind of viz usually dies. - Sampling every k-th start position when measuring fill will lie to you if k shares a factor with the grid width — it lands on aligned starts far more often than chance does and every layout looks better than it is. The demo samples every start where that is affordable and uses a coprime stride when it is not.
- The gap-tolerance chart needs vertical room; in the 480 px embed the panels shrink to keep it on screen. The site’s full-screen button is the fix.