A parent request asks a hundred leaf services in parallel and cannot answer until the slowest of them has. That single word — slowest — is the whole piece. The parent’s latency is the maximum of a hundred draws, and the maximum of many draws lives out in the tail whether or not the typical draw does.
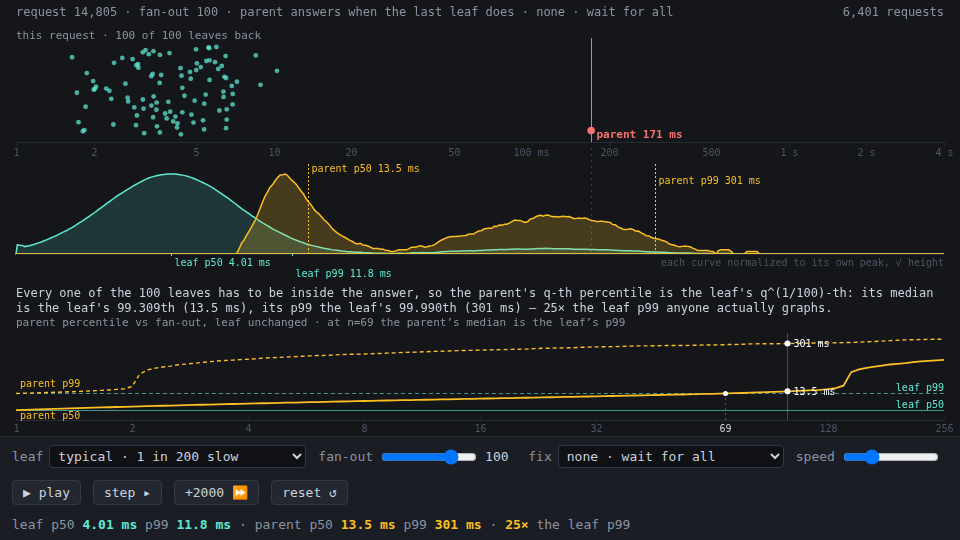
The top panel is one request: every leaf plotted where it landed on a logarithmic millisecond axis. The shape is always the same. A dense teal cluster around 4 ms, then nothing, then one lonely dot far to the right with a red line through it, because that is the one the parent is waiting for. Turn the speed down and a sweep line crosses the axis so you can watch 99 leaves come back and then sit there, waiting, for the hundredth.
Directly underneath, on the same ruler, are the two distributions the run has accumulated: teal for the leaves, amber for their parents. The red line from the request above carries on down into the amber pile it is a sample of. Two things about that picture are worth the whole build:
The amber pile is somewhere the teal one is not. Leaf p99 sits around 12 ms. Parent p99 sits around 310 ms — twenty-six times further out, from a service nobody changed. Every number on the leaf’s dashboard is still green.
The amber pile has two humps. One at 11 ms, where the tail happened to
miss all hundred leaves; one spread across 50–500 ms, where it hit at least
one. There is no middle. A fanned-out request does not degrade gradually, it
either escapes or it doesn’t, and the ratio between the humps is just
0.995^100.
The arithmetic underneath
If a leaf answers within t with probability F(t), then n independent
leaves all answer within t with probability F(t)^n. So the parent’s q-th
percentile is the leaf’s q^(1/n)-th, and the bottom strip draws exactly that
against fan-out, with the leaf’s own percentiles as flat lines that never move.
Set q = 0.5 and the leaf percentile hits 0.99 at n = 69. At a fan-out of
69 the median parent request waits as long as the slowest 1% of leaf
requests. Nothing about the service appears in that sentence — it is a fact
about maxima, and it is marked on the axis. Switch profiles and watch the
crossing dot stay put while everything around it moves.
At the default fan-out of 100, the parent’s median is the leaf’s 99.31st percentile and the parent’s p99 is the leaf’s 99.99th — a percentile no dashboard graphs and no alert fires on.
The two fixes
Both come from Dean & Barroso’s The Tail at Scale, and both are in the fix dropdown so the effect lands on the picture you were already looking at.
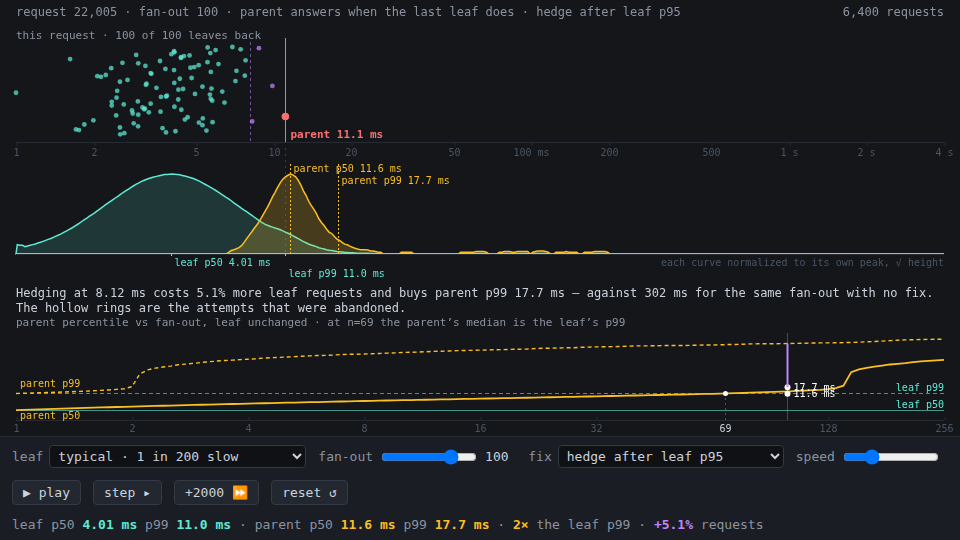
Hedge after leaf p95. Once a leaf has been outstanding longer than its own 95th percentile, send a duplicate to another replica and take whichever answers first. Because the duplicate goes out at the threshold rather than at time zero, it costs about 5% extra load — and parent p99 drops from ~305 ms to ~18 ms. On the GC pause profile it drops from 816 ms to 11 ms. In the arena, hedged leaves draw a hollow ring where the abandoned attempt was going to land and a line back to where the retry actually did; the ring is often three decades to the right of the dot.
Answer without the slowest 1% or 5%. Stop waiting once 99 of 100 leaves are in. Same collapse, paid for in completeness instead of load — and the two options apart make the interesting point. Dropping 1% takes parent p99 from 305 ms to 143 ms; dropping 5% takes it to 10 ms. Waiting for 99 of 100 still means waiting for a second straggler whenever there is one, and the runs with two slow leaves are exactly the runs p99 is measuring.
The control that matters most
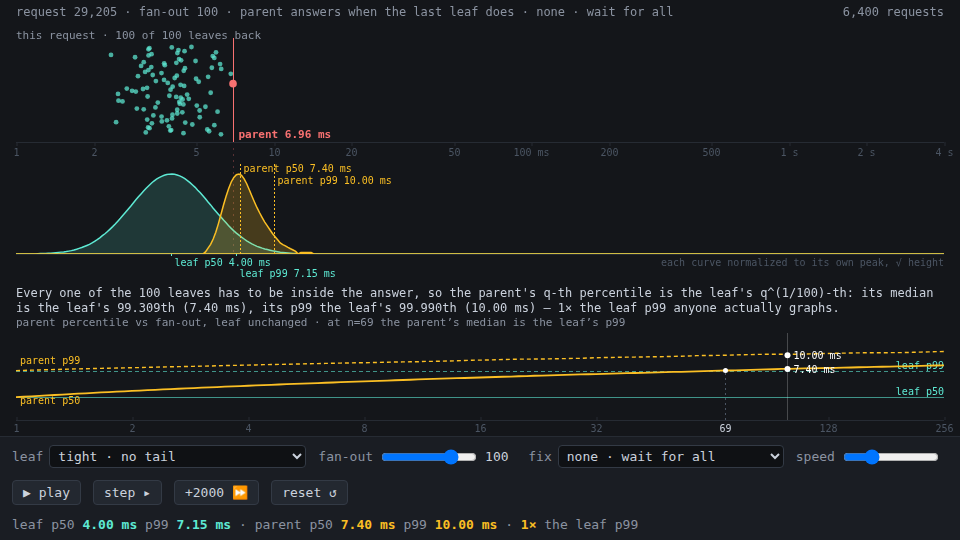
The tight · no tail profile. Same fan-out of 100, same everything, and parent p99 comes out at 10 ms against a leaf p99 of 7 ms. Not 26× — about 1.4×. Fan-out is not what costs you. The tail is what costs you, and fan-out is only the thing that reliably finds it, which is why both fixes above aim at stragglers rather than at the fan.
Reuse
src/tail.js is a framework-free ES module:
PROFILES,MITIGATIONS— leaf latency shapes (a lognormal body plus an occasional additive pause) and the policies applied on top.leafSample(seed, k, i, attempt, profile)— the latency of one attempt at one leaf, addressed rather than drawn in sequence.requestAt(k, cfg)— one whole parent request: every leaf’s original attempt, what it resolved at after any hedge, which leaf the parent ended up waiting on, and what was discarded.leafQuantiles/leafQuantile/parentQuantile— the empirical leaf distribution andF(t)^ninverted against it.newStats/record/parentPercentile/leafPercentile— running histograms on a shared log-spaced bin set.binOf,binEdge,binPercentile,formatMs,CROSSOVER.
No rendering or timers in the module; the canvas demo is reference code.
Gotchas
- Samples are addressed, not drawn in sequence.
seedFor(seed, k, i, attempt)hashes the coordinates instead of advancing one generator, so leaf 7 of request 400 is the same 4.1 ms whether the request has 8 leaves or 200. Without that, dragging the fan-out slider reshuffles every dot and the comparison it exists to make is gone. - The tail probabilities are deliberately not 1-in-100. At exactly 1% the leaf’s p99 lands on the seam between the body and the pause, where the density jumps, and the measured value swings by 3× between runs. That is a real property of that distribution and it reads as a broken number.
- Dropped leaves are drawn where they would have landed, as hollow rings to the right of the parent’s line, and they stay in the leaf histogram. A cancelled request still cost the leaf service the work; what changed is only that the parent stopped waiting. Leaving them in is what keeps the leaf p50/p99 readouts comparable across mitigations — only hedging moves them, because only hedging changes what a leaf call costs.
F(t)^nassumes the leaves are independent, which is the assumption worth doubting in production — a shared GC, a shared disk, or a shared network fabric correlates them, and correlated stragglers are strictly worse than this model. The piece is a lower bound on the problem.- The leaf CDF is measured, not derived. A lognormal plus an occasional
lognormal pause has no tidy closed-form quantile, so
leafQuantilessorts 120k draws and interpolates — deep enough for the parent p99 curve out to fan-out 256, and honest about being an estimate. It is memoized per profile; computing it per frame makes the slider crawl. - Both distributions accumulate straight into bins, so a run can go to millions of requests without the frame loop re-sorting a growing array. The cost is 2.1%-wide buckets, which is finer than the sampling noise that put the counts there.
- Histogram heights are square-rooted. The parent’s tail lobe holds 40% of the mass but spread over a decade of a log axis; against a linear peak it flattens into a smear and the p99 tick ends up marking nothing you can see.
- The bottom strip fits its own latency range rather than sharing the ruler above it — over 1 ms to 4 s the two parent curves sit a dozen pixels apart and say nothing. Its x axis is fan-out, so it was never the same axis anyway.
- The demo bundles its own copy of
tail.js(self-contained by contract); re-copy after editingsrc/.